
 Yahoo Finance
 How Financially Strong Is Bunzl plc (LON:BNZL)?

Investors seeking to preserve capital in a volatile environment might consider large-cap stocks such as Bunzl plc (LON:BNZL) a safer option. Big corporations are much sought after by risk-averse investors who find diversified revenue streams and strong capital returns attractive. However, the key to their continued success lies in its financial health. This article will examine Bunzl’s financial liquidity and debt levels to get an idea of whether the company can deal with cyclical downturns and maintain funds to accommodate strategic spending for future growth. Note that this information is centred entirely on financial health and is a high-level overview, so I encourage you to look further into BNZL here.
See our latest analysis for Bunzl
BNZL’s Debt (And Cash Flows)
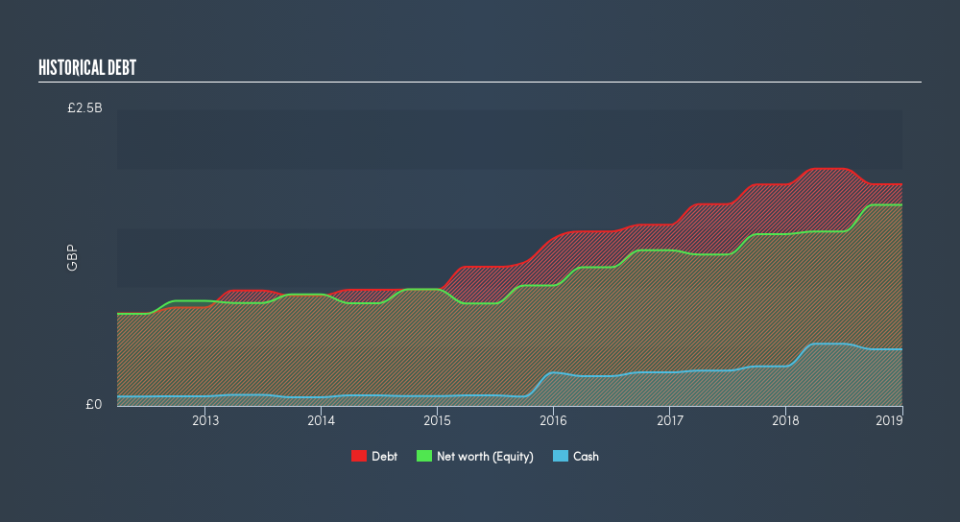
BNZL’s debt level has been constant at around UK£1.9b over the previous year – this includes long-term debt. At this constant level of debt, BNZL’s cash and short-term investments stands at UK£478m , ready to be used for running the business. Moreover, BNZL has produced cash from operations of UK£480m over the same time period, resulting in an operating cash to total debt ratio of 26%, indicating that BNZL’s current level of operating cash is high enough to cover debt.
Does BNZL’s liquid assets cover its short-term commitments?
At the current liabilities level of UK£2.1b, the company has maintained a safe level of current assets to meet its obligations, with the current ratio last standing at 1.43x. The current ratio is calculated by dividing current assets by current liabilities. Generally, for Trade Distributors companies, this is a reasonable ratio since there is a bit of a cash buffer without leaving too much capital in a low-return environment.
Does BNZL face the risk of succumbing to its debt-load?
Considering Bunzl’s total debt outweighs its equity, the company is deemed highly levered. This is common amongst large-cap companies because debt can often be a less expensive alternative to equity due to tax deductibility of interest payments. Accordingly, large companies often have lower cost of capital due to easily obtained financing, providing an advantage over smaller companies. We can assess the sustainability of BNZL’s debt levels to the test by looking at how well interest payments are covered by earnings. Preferably, earnings before interest and tax (EBIT) should be at least three times as large as net interest. In BNZL’s case, the ratio of 9.35x suggests that interest is appropriately covered. High interest coverage serves as an indication of the safety of a company, which highlights why many large organisations like BNZL are considered a risk-averse investment.
Next Steps:
Although BNZL’s debt level is towards the higher end of the spectrum, its cash flow coverage seems adequate to meet obligations which means its debt is being efficiently utilised. Since there is also no concerns around BNZL’s liquidity needs, this may be its optimal capital structure for the time being. I admit this is a fairly basic analysis for BNZL’s financial health. Other important fundamentals need to be considered alongside. I recommend you continue to research Bunzl to get a better picture of the large-cap by looking at:
Future Outlook: What are well-informed industry analysts predicting for BNZL’s future growth? Take a look at our free research report of analyst consensus for BNZL’s outlook.
Valuation: What is BNZL worth today? Is the stock undervalued, even when its growth outlook is factored into its intrinsic value? The intrinsic value infographic in our free research report helps visualize whether BNZL is currently mispriced by the market.
Other High-Performing Stocks: Are there other stocks that provide better prospects with proven track records? Explore our free list of these great stocks here.
We aim to bring you long-term focused research analysis driven by fundamental data. Note that our analysis may not factor in the latest price-sensitive company announcements or qualitative material.
If you spot an error that warrants correction, please contact the editor at editorial-team@simplywallst.com. This article by Simply Wall St is general in nature. It does not constitute a recommendation to buy or sell any stock, and does not take account of your objectives, or your financial situation. Simply Wall St has no position in the stocks mentioned. Thank you for reading.
