
 Yahoo Finance
 How Financially Strong Is Electrocomponents plc (LON:ECM)?

Want to participate in a short research study? Help shape the future of investing tools and you could win a $250 gift card!
Small-caps and large-caps are wildly popular among investors, however, mid-cap stocks, such as Electrocomponents plc (LON:ECM), with a market capitalization of UK£2.6b, rarely draw their attention from the investing community. However, generally ignored mid-caps have historically delivered better risk adjusted returns than both of those groups. This article will examine ECM’s financial liquidity and debt levels to get an idea of whether the company can deal with cyclical downturns and maintain funds to accommodate strategic spending for future growth. Don’t forget that this is a general and concentrated examination of Electrocomponents’s financial health, so you should conduct further analysis into ECM here.
Check out our latest analysis for Electrocomponents
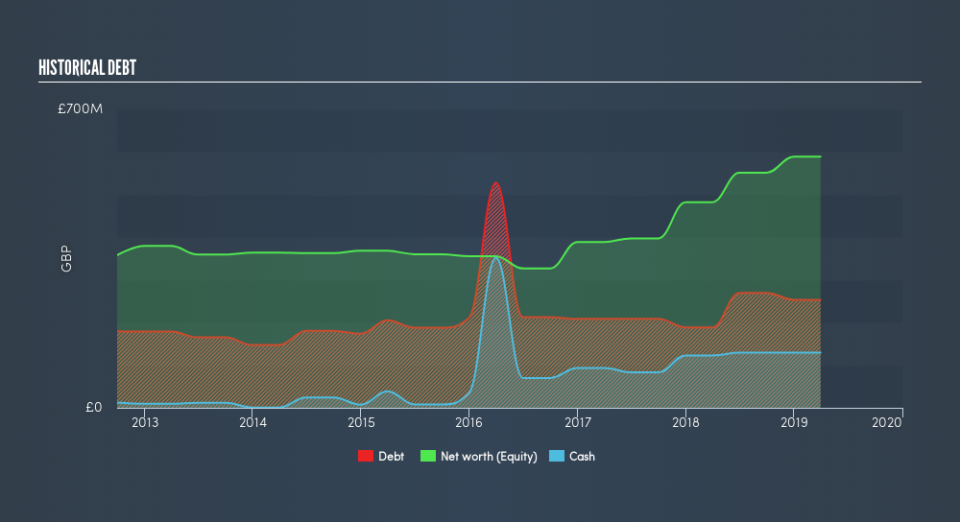
ECM’s Debt (And Cash Flows)
ECM has built up its total debt levels in the last twelve months, from UK£188m to UK£253m – this includes long-term debt. With this rise in debt, ECM currently has UK£129m remaining in cash and short-term investments , ready to be used for running the business. Additionally, ECM has generated UK£127m in operating cash flow in the last twelve months, resulting in an operating cash to total debt ratio of 50%, signalling that ECM’s operating cash is sufficient to cover its debt.
Does ECM’s liquid assets cover its short-term commitments?
Looking at ECM’s UK£488m in current liabilities, the company has maintained a safe level of current assets to meet its obligations, with the current ratio last standing at 1.92x. The current ratio is the number you get when you divide current assets by current liabilities. Usually, for Electronic companies, this is a suitable ratio as there's enough of a cash buffer without holding too much capital in low return investments.
Is ECM’s debt level acceptable?
ECM is a relatively highly levered company with a debt-to-equity of 43%. This is not unusual for mid-caps as debt tends to be a cheaper and faster source of funding for some businesses. No matter how high the company’s debt, if it can easily cover the interest payments, it’s considered to be efficient with its use of excess leverage. A company generating earnings after interest and tax at least three times its net interest payments is considered financially sound. In ECM's case, the ratio of 34.46x suggests that interest is comfortably covered, which means that lenders may be inclined to lend more money to the company, as it is seen as safe in terms of payback.
Next Steps:
ECM’s high cash coverage means that, although its debt levels are high, the company is able to utilise its borrowings efficiently in order to generate cash flow. This may mean this is an optimal capital structure for the business, given that it is also meeting its short-term commitment. I admit this is a fairly basic analysis for ECM's financial health. Other important fundamentals need to be considered alongside. You should continue to research Electrocomponents to get a more holistic view of the mid-cap by looking at:
Future Outlook: What are well-informed industry analysts predicting for ECM’s future growth? Take a look at our free research report of analyst consensus for ECM’s outlook.
Valuation: What is ECM worth today? Is the stock undervalued, even when its growth outlook is factored into its intrinsic value? The intrinsic value infographic in our free research report helps visualize whether ECM is currently mispriced by the market.
Other High-Performing Stocks: Are there other stocks that provide better prospects with proven track records? Explore our free list of these great stocks here.
We aim to bring you long-term focused research analysis driven by fundamental data. Note that our analysis may not factor in the latest price-sensitive company announcements or qualitative material.
If you spot an error that warrants correction, please contact the editor at editorial-team@simplywallst.com. This article by Simply Wall St is general in nature. It does not constitute a recommendation to buy or sell any stock, and does not take account of your objectives, or your financial situation. Simply Wall St has no position in the stocks mentioned. Thank you for reading.
