
 Yahoo Finance
 How Financially Strong Is Greencore Group plc (LON:GNC)?

Want to participate in a short research study? Help shape the future of investing tools and receive a $20 prize!
Greencore Group plc (LON:GNC) is a small-cap stock with a market capitalization of UK£900m. While investors primarily focus on the growth potential and competitive landscape of the small-cap companies, they end up ignoring a key aspect, which could be the biggest threat to its existence: its financial health. Why is it important? Evaluating financial health as part of your investment thesis is essential, as mismanagement of capital can lead to bankruptcies, which occur at a higher rate for small-caps. I believe these basic checks tell most of the story you need to know. However, given that I have not delve into the company-specifics, I suggest you dig deeper yourself into GNC here.
How much cash does GNC generate through its operations?
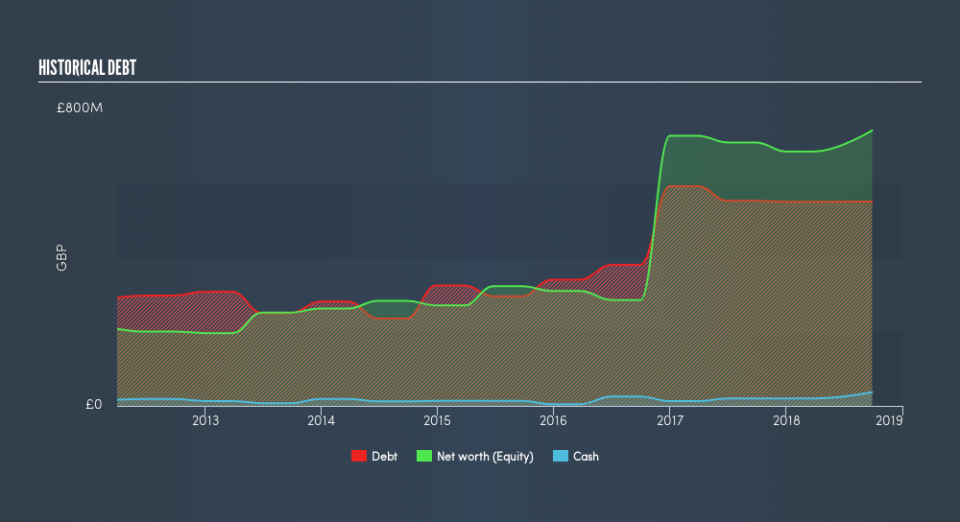
GNC’s debt level has been constant at around UK£552m over the previous year which accounts for long term debt. At this current level of debt, GNC’s cash and short-term investments stands at UK£37m , ready to deploy into the business. On top of this, GNC has produced UK£130m in operating cash flow over the same time period, resulting in an operating cash to total debt ratio of 24%, indicating that GNC’s debt is appropriately covered by operating cash. This ratio can also be interpreted as a measure of efficiency as an alternative to return on assets. In GNC’s case, it is able to generate 0.24x cash from its debt capital.
Does GNC’s liquid assets cover its short-term commitments?
With current liabilities at UK£599m, it appears that the company has maintained a safe level of current assets to meet its obligations, with the current ratio last standing at 2.01x. Generally, for Food companies, this is a reasonable ratio as there’s enough of a cash buffer without holding too much capital in low return investments.
Can GNC service its debt comfortably?
With debt reaching 74% of equity, GNC may be thought of as relatively highly levered. This is not uncommon for a small-cap company given that debt tends to be lower-cost and at times, more accessible. No matter how high the company’s debt, if it can easily cover the interest payments, it’s considered to be efficient with its use of excess leverage. A company generating earnings after interest and tax at least three times its net interest payments is considered financially sound. In GNC’s case, the ratio of 3.33x suggests that interest is appropriately covered, which means that lenders may be inclined to lend more money to the company, as it is seen as safe in terms of payback.
Next Steps:
GNC’s high cash coverage means that, although its debt levels are high, the company is able to utilise its borrowings efficiently in order to generate cash flow. Since there is also no concerns around GNC’s liquidity needs, this may be its optimal capital structure for the time being. I admit this is a fairly basic analysis for GNC’s financial health. Other important fundamentals need to be considered alongside. You should continue to research Greencore Group to get a more holistic view of the small-cap by looking at:
Future Outlook: What are well-informed industry analysts predicting for GNC’s future growth? Take a look at our free research report of analyst consensus for GNC’s outlook.
Valuation: What is GNC worth today? Is the stock undervalued, even when its growth outlook is factored into its intrinsic value? The intrinsic value infographic in our free research report helps visualize whether GNC is currently mispriced by the market.
Other High-Performing Stocks: Are there other stocks that provide better prospects with proven track records? Explore our free list of these great stocks here.
We aim to bring you long-term focused research analysis driven by fundamental data. Note that our analysis may not factor in the latest price-sensitive company announcements or qualitative material.
If you spot an error that warrants correction, please contact the editor at editorial-team@simplywallst.com. This article by Simply Wall St is general in nature. It does not constitute a recommendation to buy or sell any stock, and does not take account of your objectives, or your financial situation. Simply Wall St has no position in the stocks mentioned. Thank you for reading.
