
 Yahoo Finance
 How Financially Strong Is K3 Business Technology Group plc (LON:KBT)?

Investors are always looking for growth in small-cap stocks like K3 Business Technology Group plc (LON:KBT), with a market cap of UK£87.87m. However, an important fact which most ignore is: how financially healthy is the business? Software companies, in particular ones that run negative earnings, tend to be high risk. Evaluating financial health as part of your investment thesis is crucial. Here are a few basic checks that are good enough to have a broad overview of the company’s financial strength. Though, since I only look at basic financial figures, I suggest you dig deeper yourself into KBT here.
How does KBT’s operating cash flow stack up against its debt?
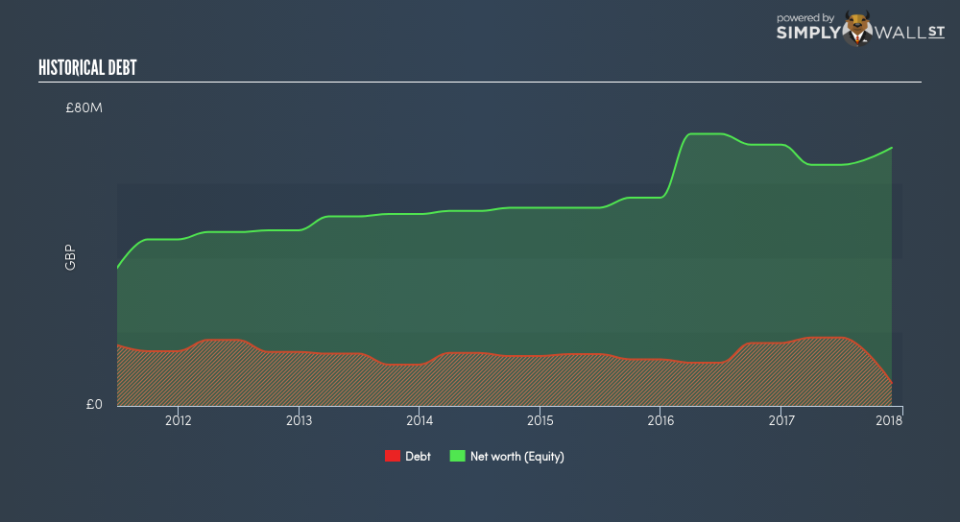
KBT has shrunken its total debt levels in the last twelve months, from UK£16.97m to UK£6.23m , which is made up of current and long term debt. With this debt repayment, KBT’s cash and short-term investments stands at UK£1.94m , ready to deploy into the business. Moreover, KBT has generated cash from operations of UK£3.58m over the same time period, leading to an operating cash to total debt ratio of 57.49%, signalling that KBT’s operating cash is sufficient to cover its debt. This ratio can also be interpreted as a measure of efficiency for loss making businesses since metrics such as return on asset (ROA) requires positive earnings. In KBT’s case, it is able to generate 0.57x cash from its debt capital.
Does KBT’s liquid assets cover its short-term commitments?
With current liabilities at UK£29.44m, the company has been able to meet these commitments with a current assets level of UK£32.37m, leading to a 1.1x current account ratio. For Software companies, this ratio is within a sensible range as there’s enough of a cash buffer without holding too capital in low return investments.
Is KBT’s debt level acceptable?
KBT’s level of debt is low relative to its total equity, at 8.94%. KBT is not taking on too much debt commitment, which may be constraining for future growth. Investors’ risk associated with debt is virtually non-existent with KBT, and the company has plenty of headroom and ability to raise debt should it need to in the future.
Next Steps:
KBT’s high cash coverage and low debt levels indicate its ability to utilise its borrowings efficiently in order to generate ample cash flow. In addition to this, the company will be able to pay all of its upcoming liabilities from its current short-term assets. I admit this is a fairly basic analysis for KBT’s financial health. Other important fundamentals need to be considered alongside. I suggest you continue to research K3 Business Technology Group to get a better picture of the stock by looking at:
Future Outlook: What are well-informed industry analysts predicting for KBT’s future growth? Take a look at our free research report of analyst consensus for KBT’s outlook.
Valuation: What is KBT worth today? Is the stock undervalued, even when its growth outlook is factored into its intrinsic value? The intrinsic value infographic in our free research report helps visualize whether KBT is currently mispriced by the market.
Other High-Performing Stocks: Are there other stocks that provide better prospects with proven track records? Explore our free list of these great stocks here.
To help readers see pass the short term volatility of the financial market, we aim to bring you a long-term focused research analysis purely driven by fundamental data. Note that our analysis does not factor in the latest price sensitive company announcements.
The author is an independent contributor and at the time of publication had no position in the stocks mentioned.
