
 Yahoo Finance
 How Financially Strong Is Rurelec PLC (LON:RUR)?

While small-cap stocks, such as Rurelec PLC (AIM:RUR) with its market cap of UK£4.07M, are popular for their explosive growth, investors should also be aware of their balance sheet to judge whether the company can survive a downturn. Since RUR is loss-making right now, it’s essential to assess the current state of its operations and pathway to profitability. I believe these basic checks tell most of the story you need to know. However, this commentary is still very high-level, so I’d encourage you to dig deeper yourself into RUR here.
How does RUR’s operating cash flow stack up against its debt?
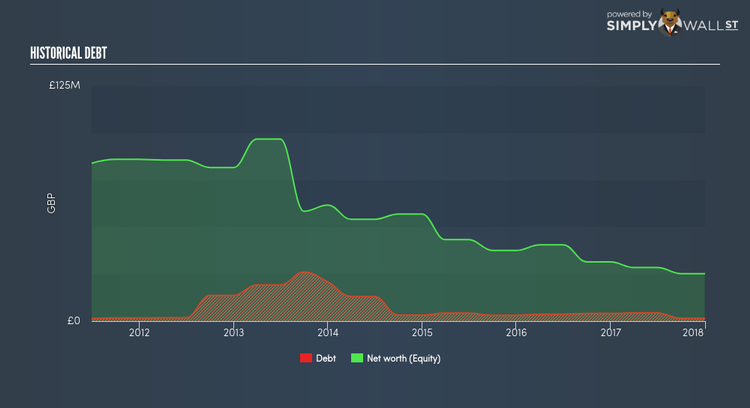
Over the past year, RUR has reduced its debt from UK£4.04M to UK£1.45M . With this debt repayment, RUR’s cash and short-term investments stands at UK£163.00K for investing into the business. Moving onto cash from operations, its trivial cash flows from operations make the cash-to-debt ratio less useful to us, though these low levels of cash means that operational efficiency is worth a look. For this article’s sake, I won’t be looking at this today, but you can assess some of RUR’s operating efficiency ratios such as ROA here.
Can RUR meet its short-term obligations with the cash in hand?
At the current liabilities level of UK£5.87M liabilities, it seems that the business has been able to meet these commitments with a current assets level of UK£21.38M, leading to a 3.64x current account ratio. Though, a ratio greater than 3x may be considered as too high, as RUR could be holding too much capital in a low-return investment environment.
Does RUR face the risk of succumbing to its debt-load?
With debt at 5.74% of equity, RUR may be thought of as having low leverage. RUR is not taking on too much debt commitment, which may be constraining for future growth. RUR’s risk around capital structure is almost non-existent, and the company has the headroom and ability to raise debt should it need to in the future.
Next Steps:
RUR’s cash flow coverage indicates it could improve its operating efficiency in order to meet demand for debt repayments should unforeseen events arise. However, the company exhibits an ability to meet its near term obligations should an adverse event occur. Keep in mind I haven’t considered other factors such as how RUR has been performing in the past. I suggest you continue to research Rurelec to get a better picture of the stock by looking at:
Valuation: What is RUR worth today? Is the stock undervalued, even when its growth outlook is factored into its intrinsic value? The intrinsic value infographic in our free research report helps visualize whether RUR is currently mispriced by the market.
Historical Performance: What has RUR’s returns been like over the past? Go into more detail in the past track record analysis and take a look at the free visual representations of our analysis for more clarity.
Other High-Performing Stocks: Are there other stocks that provide better prospects with proven track records? Explore our free list of these great stocks here.
To help readers see pass the short term volatility of the financial market, we aim to bring you a long-term focused research analysis purely driven by fundamental data. Note that our analysis does not factor in the latest price sensitive company announcements.
The author is an independent contributor and at the time of publication had no position in the stocks mentioned.
