
 Yahoo Finance
 How Financially Strong Is Tesco PLC (LON:TSCO)?

Investors pursuing a solid, dependable stock investment can often be led to Tesco PLC (LSE:TSCO), a large-cap worth UK£24.11B. Doing business globally, large caps tend to have diversified revenue streams and attractive capital returns, making them desirable investments for risk-averse portfolios. However, the key to extending previous success is in the health of the company’s financials. Today we will look at Tesco’s financial liquidity and debt levels, which are strong indicators for whether the company can weather economic downturns or fund strategic acquisitions for future growth. Note that this information is centred entirely on financial health and is a high-level overview, so I encourage you to look further into TSCO here. View our latest analysis for Tesco
How much cash does TSCO generate through its operations?
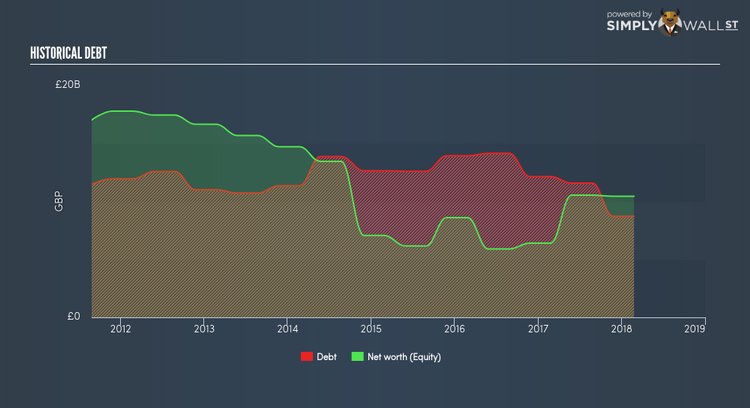
Over the past year, TSCO has reduced its debt from UK£12.15B to UK£8.73B , which comprises of short- and long-term debt. With this reduction in debt, TSCO’s cash and short-term investments stands at UK£3.78B for investing into the business. On top of this, TSCO has produced cash from operations of UK£2.78B during the same period of time, leading to an operating cash to total debt ratio of 31.88%, meaning that TSCO’s debt is appropriately covered by operating cash. This ratio can also be a sign of operational efficiency as an alternative to return on assets. In TSCO’s case, it is able to generate 0.32x cash from its debt capital.
Can TSCO pay its short-term liabilities?
At the current liabilities level of UK£19.24B liabilities, it appears that the company has not been able to meet these commitments with a current assets level of UK£13.73B, leading to a 0.71x current account ratio. which is under the appropriate industry ratio of 3x.
Can TSCO service its debt comfortably?
With a debt-to-equity ratio of 83.44%, TSCO can be considered as an above-average leveraged company. This isn’t surprising for large-caps, as equity can often be more expensive to issue than debt, plus interest payments are tax deductible. Consequently, larger-cap organisations tend to enjoy lower cost of capital as a result of easily attained financing, providing an advantage over smaller companies. We can check to see whether TSCO is able to meet its debt obligations by looking at the net interest coverage ratio. Net interest should be covered by earnings before interest and tax (EBIT) by at least three times to be safe. For TSCO, the ratio of 4.6x suggests that interest is appropriately covered. High interest coverage serves as an indication of the safety of a company, which highlights why many large organisations like TSCO are considered a risk-averse investment.
Next Steps:
TSCO’s high cash coverage means that, although its debt levels are high, the company is able to utilise its borrowings efficiently in order to generate cash flow. Though its lack of liquidity raises questions over current asset management practices for the large-cap. This is only a rough assessment of financial health, and I’m sure TSCO has company-specific issues impacting its capital structure decisions. I recommend you continue to research Tesco to get a better picture of the stock by looking at:
Future Outlook: What are well-informed industry analysts predicting for TSCO’s future growth? Take a look at our free research report of analyst consensus for TSCO’s outlook.
Valuation: What is TSCO worth today? Is the stock undervalued, even when its growth outlook is factored into its intrinsic value? The intrinsic value infographic in our free research report helps visualize whether TSCO is currently mispriced by the market.
Other High-Performing Stocks: Are there other stocks that provide better prospects with proven track records? Explore our free list of these great stocks here.
To help readers see pass the short term volatility of the financial market, we aim to bring you a long-term focused research analysis purely driven by fundamental data. Note that our analysis does not factor in the latest price sensitive company announcements.
The author is an independent contributor and at the time of publication had no position in the stocks mentioned.
