
 Yahoo Finance
 Do Its Financials Have Any Role To Play In Driving Xylem Inc.'s (NYSE:XYL) Stock Up Recently?
Xylem (NYSE:XYL) has had a great run on the share market with its stock up by a significant 14% over the last three months. We wonder if and what role the company's financials play in that price change as a company's long-term fundamentals usually dictate market outcomes. Specifically, we decided to study Xylem's ROE in this article.
Return on equity or ROE is a key measure used to assess how efficiently a company's management is utilizing the company's capital. Put another way, it reveals the company's success at turning shareholder investments into profits.
View our latest analysis for Xylem
How To Calculate Return On Equity?
Return on equity can be calculated by using the formula:
Return on Equity = Net Profit (from continuing operations) ÷ Shareholders' Equity
So, based on the above formula, the ROE for Xylem is:
13% = US$421m ÷ US$3.2b (Based on the trailing twelve months to June 2022).
The 'return' is the profit over the last twelve months. That means that for every $1 worth of shareholders' equity, the company generated $0.13 in profit.
What Is The Relationship Between ROE And Earnings Growth?
So far, we've learned that ROE is a measure of a company's profitability. We now need to evaluate how much profit the company reinvests or "retains" for future growth which then gives us an idea about the growth potential of the company. Generally speaking, other things being equal, firms with a high return on equity and profit retention, have a higher growth rate than firms that don’t share these attributes.
Xylem's Earnings Growth And 13% ROE
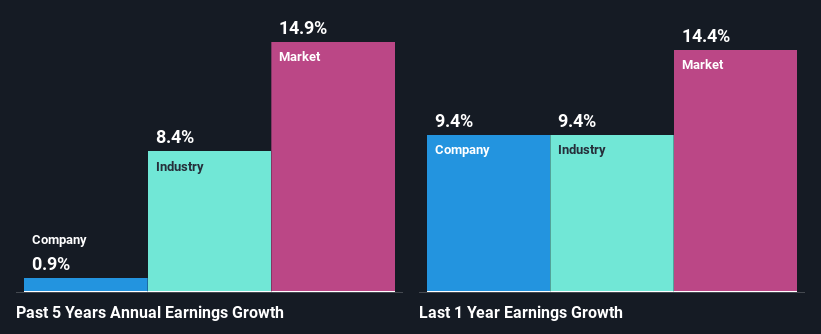
To start with, Xylem's ROE looks acceptable. Even when compared to the industry average of 13% the company's ROE looks quite decent. Given the circumstances, we can't help but wonder why Xylem saw little to no growth in the past five years. So, there could be some other aspects that could potentially be preventing the company from growing. Such as, the company pays out a huge portion of its earnings as dividends, or is faced with competitive pressures.
We then compared Xylem's net income growth with the industry and found that the company's growth figure is lower than the average industry growth rate of 8.4% in the same period, which is a bit concerning.
The basis for attaching value to a company is, to a great extent, tied to its earnings growth. What investors need to determine next is if the expected earnings growth, or the lack of it, is already built into the share price. This then helps them determine if the stock is placed for a bright or bleak future. Is XYL fairly valued? This infographic on the company's intrinsic value has everything you need to know.
Is Xylem Making Efficient Use Of Its Profits?
Despite having a moderate three-year median payout ratio of 49% (meaning the company retains51% of profits) in the last three-year period, Xylem's earnings growth was more or les flat. So there might be other factors at play here which could potentially be hampering growth. For example, the business has faced some headwinds.
Moreover, Xylem has been paying dividends for at least ten years or more suggesting that management must have perceived that the shareholders prefer dividends over earnings growth. Our latest analyst data shows that the future payout ratio of the company is expected to drop to 35% over the next three years. As a result, the expected drop in Xylem's payout ratio explains the anticipated rise in the company's future ROE to 20%, over the same period.
Summary
On the whole, we do feel that Xylem has some positive attributes. Yet, the low earnings growth is a bit concerning, especially given that the company has a high rate of return and is reinvesting ma huge portion of its profits. By the looks of it, there could be some other factors, not necessarily in control of the business, that's preventing growth. Having said that, looking at the current analyst estimates, we found that the company's earnings are expected to gain momentum. To know more about the company's future earnings growth forecasts take a look at this free report on analyst forecasts for the company to find out more.
Have feedback on this article? Concerned about the content? Get in touch with us directly. Alternatively, email editorial-team (at) simplywallst.com.
This article by Simply Wall St is general in nature. We provide commentary based on historical data and analyst forecasts only using an unbiased methodology and our articles are not intended to be financial advice. It does not constitute a recommendation to buy or sell any stock, and does not take account of your objectives, or your financial situation. We aim to bring you long-term focused analysis driven by fundamental data. Note that our analysis may not factor in the latest price-sensitive company announcements or qualitative material. Simply Wall St has no position in any stocks mentioned.
Join A Paid User Research Session
You’ll receive a US$30 Amazon Gift card for 1 hour of your time while helping us build better investing tools for the individual investors like yourself. Sign up here
