
 Yahoo Finance
 Are FireEye Inc’s (NASDAQ:FEYE) Interest Costs Too High?

Small-cap and large-cap companies receive a lot of attention from investors, but mid-cap stocks like FireEye Inc (NASDAQ:FEYE), with a market cap of US$3.20b, are often out of the spotlight. However, generally ignored mid-caps have historically delivered better risk adjusted returns than both of those groups. FEYE’s financial liquidity and debt position will be analysed in this article, to get an idea of whether the company can fund opportunities for strategic growth and maintain strength through economic downturns. Remember this is a very top-level look that focuses exclusively on financial health, so I recommend a deeper analysis into FEYE here. View out our latest analysis for FireEye
How does FEYE’s operating cash flow stack up against its debt?
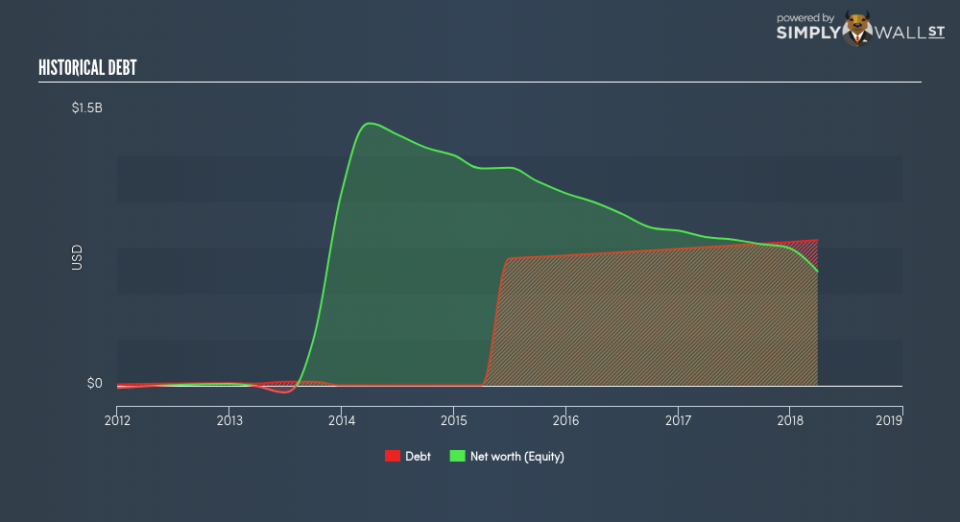
FEYE has built up its total debt levels in the last twelve months, from US$741.98m to US$0 , which comprises of short- and long-term debt. With this growth in debt, the current cash and short-term investment levels stands at US$896.80m for investing into the business. Additionally, FEYE has generated cash from operations of US$17.64m over the same time period, leading to an operating cash to total debt ratio of 2.26%, signalling that FEYE’s debt is not appropriately covered by operating cash. This ratio can also be a sign of operational efficiency for loss making businesses since metrics such as return on asset (ROA) requires a positive net income. In FEYE’s case, it is able to generate 0.023x cash from its debt capital.
Can FEYE meet its short-term obligations with the cash in hand?
At the current liabilities level of US$557.91m liabilities, it appears that the company has been able to meet these obligations given the level of current assets of US$1.08b, with a current ratio of 1.93x. For Software companies, this ratio is within a sensible range as there’s enough of a cash buffer without holding too capital in low return investments.
Can FEYE service its debt comfortably?
FEYE is a highly-leveraged company with debt exceeding equity by over 100%. This is not unusual for mid-caps as debt tends to be a cheaper and faster source of funding for some businesses. But since FEYE is currently loss-making, sustainability of its current state of operations becomes a concern. Running high debt, while not yet making money, can be risky in unexpected downturns as liquidity may dry up, making it hard to operate.
Next Steps:
FEYE’s debt and cash flow levels indicate room for improvement. Its cash flow coverage of less than a quarter of debt means that operating efficiency could be an issue. Though, the company exhibits proper management of current assets and upcoming liabilities. I admit this is a fairly basic analysis for FEYE’s financial health. Other important fundamentals need to be considered alongside. You should continue to research FireEye to get a more holistic view of the stock by looking at:
Future Outlook: What are well-informed industry analysts predicting for FEYE’s future growth? Take a look at our free research report of analyst consensus for FEYE’s outlook.
Valuation: What is FEYE worth today? Is the stock undervalued, even when its growth outlook is factored into its intrinsic value? The intrinsic value infographic in our free research report helps visualize whether FEYE is currently mispriced by the market.
Other High-Performing Stocks: Are there other stocks that provide better prospects with proven track records? Explore our free list of these great stocks here.
To help readers see pass the short term volatility of the financial market, we aim to bring you a long-term focused research analysis purely driven by fundamental data. Note that our analysis does not factor in the latest price sensitive company announcements.
The author is an independent contributor and at the time of publication had no position in the stocks mentioned.
