
 Yahoo Finance
 The five-year decline in earnings might be taking its toll on Ryman Hospitality Properties (NYSE:RHP) shareholders as stock falls 5.3% over the past week
When you buy and hold a stock for the long term, you definitely want it to provide a positive return. But more than that, you probably want to see it rise more than the market average. But Ryman Hospitality Properties, Inc. (NYSE:RHP) has fallen short of that second goal, with a share price rise of 22% over five years, which is below the market return. Zooming in, the stock is actually down 2.0% in the last year.
Although Ryman Hospitality Properties has shed US$260m from its market cap this week, let's take a look at its longer term fundamental trends and see if they've driven returns.
See our latest analysis for Ryman Hospitality Properties
While the efficient markets hypothesis continues to be taught by some, it has been proven that markets are over-reactive dynamic systems, and investors are not always rational. By comparing earnings per share (EPS) and share price changes over time, we can get a feel for how investor attitudes to a company have morphed over time.
During the five years of share price growth, Ryman Hospitality Properties moved from a loss to profitability. That's generally thought to be a genuine positive, so we would expect to see an increasing share price.
The graphic below depicts how EPS has changed over time (unveil the exact values by clicking on the image).
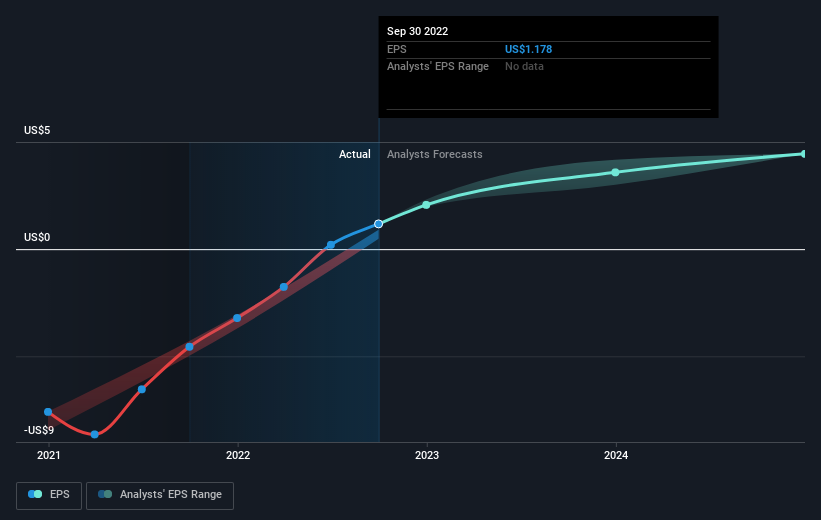
We know that Ryman Hospitality Properties has improved its bottom line lately, but is it going to grow revenue? Check if analysts think Ryman Hospitality Properties will grow revenue in the future.
What About Dividends?
As well as measuring the share price return, investors should also consider the total shareholder return (TSR). The TSR is a return calculation that accounts for the value of cash dividends (assuming that any dividend received was reinvested) and the calculated value of any discounted capital raisings and spin-offs. So for companies that pay a generous dividend, the TSR is often a lot higher than the share price return. As it happens, Ryman Hospitality Properties' TSR for the last 5 years was 39%, which exceeds the share price return mentioned earlier. This is largely a result of its dividend payments!
A Different Perspective
Although it hurts that Ryman Hospitality Properties returned a loss of 1.8% in the last twelve months, the broader market was actually worse, returning a loss of 21%. Longer term investors wouldn't be so upset, since they would have made 7%, each year, over five years. It could be that the business is just facing some short term problems, but shareholders should keep a close eye on the fundamentals. It's always interesting to track share price performance over the longer term. But to understand Ryman Hospitality Properties better, we need to consider many other factors. Like risks, for instance. Every company has them, and we've spotted 2 warning signs for Ryman Hospitality Properties (of which 1 is potentially serious!) you should know about.
Of course, you might find a fantastic investment by looking elsewhere. So take a peek at this free list of companies we expect will grow earnings.
Please note, the market returns quoted in this article reflect the market weighted average returns of stocks that currently trade on US exchanges.
Have feedback on this article? Concerned about the content? Get in touch with us directly. Alternatively, email editorial-team (at) simplywallst.com.
This article by Simply Wall St is general in nature. We provide commentary based on historical data and analyst forecasts only using an unbiased methodology and our articles are not intended to be financial advice. It does not constitute a recommendation to buy or sell any stock, and does not take account of your objectives, or your financial situation. We aim to bring you long-term focused analysis driven by fundamental data. Note that our analysis may not factor in the latest price-sensitive company announcements or qualitative material. Simply Wall St has no position in any stocks mentioned.
Join A Paid User Research Session
You’ll receive a US$30 Amazon Gift card for 1 hour of your time while helping us build better investing tools for the individual investors like yourself. Sign up here
