
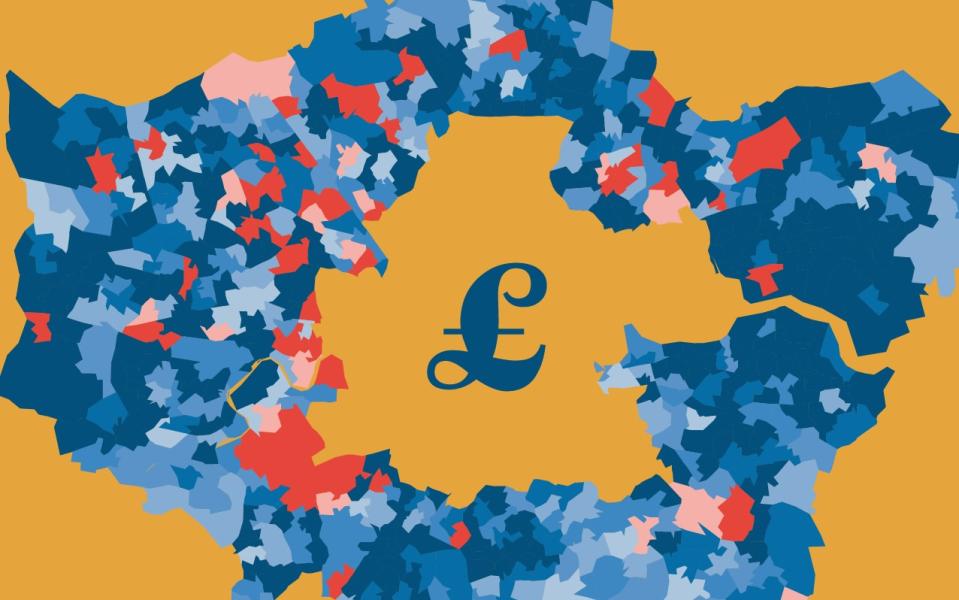
 Yahoo Finance
 Five maps that show exactly what's going on with London's housing market
With the UK having endured a prolonged period of low interest rates, London's property market has been one of the most reliable places for investment in recent years.
However, rising prices have led to higher stamp duty fees and as of April 2016 anyone wishing to purchase a second home in the capital has been hit with a 3pc stamp duty surcharge. This has affected sales volumes and subsequently prices as well.
Here, a Telegraph analysis of detailed house price statistics from the Land Registry and the Office for National Statistics shines a light on exactly what is going on in London's housing market. Is it still an investment opportunity or has the life been taxed out of it?
Sales volumes have dropped across the board
The most obvious indication of a slowdown in the housing market is a reduction in the number of sales that are taking place.
An analysis of Land Registry transaction data over the past two years has revealed that nearly 60pc of Middle Super Output Areas (MSOA) - local authority sub-divisions - in London observed a lower number of transactions in the year to September 2016 compared to the previous 12-month period.
Property sales volumes are down across London areas
This was the same for both inner and outer London while for the rest of England and Wales, only 40pc of areas recorded a drop in transactions.
The discrepancy between these figures for London and the rest of the country indicates that there has been a particular slowdown in the volume of sales taking place in the capital.
Property sales volume has fallen all over London
Harrow in north-west London saw sales drop in 77pc of its sub-divisions, the most for any London borough, while it was the same for 76pc of the sub-divisions in Kensington and Chelsea and 74pc of Lambeth's sub-divisions.
The most expensive areas have seen price decreases
Property prices in the central west London areas of Kensington, Chelsea, Hammersmith and Fulham are routinely recorded as being the highest in Britain, and so provide a good guide to the top end of the market.
The ONS presents 'price paid' figures on an MSOA level; there are nearly 1,000 of these subdivisions in London.
Within Kensington and Chelsea, 11 of the area's 21 MSOA subdivisions saw a drop in house prices between September 2015 and September 2016. The same is true for 12 of 25 Hammersmith and Fulham subdivisions.
This gives both boroughs a decrease rate of about 50pc, more than double the 22.3pc of areas that have experienced decreases across England and Wales.
Across London, 40pc of the most expensive areas have observed a drop in house prices in the past year.
Price falls in outer London are less pronounced
Property price falls are less widespread in outer London boroughs.
Just 10pc of the 687 outer London sub-divisions saw prices fall in the year to September. This compares to 21pc in inner London boroughs.
Outer west London boroughs were the area most likely to record price falls.
Inner vs Outer London house prices
Outside London, the proportion of areas that experienced a drop in house prices over the same period was at 23.5pc.
This would suggest that - away from the high-end areas of Kensington and Chelsea - London is still doing well in the house price stakes.
Around 9pc of subdivisions in London saw average values increase by a quarter or more in the year to September.
Where have London house prices risen quickest?
This was only the fourth largest increase for any of the UK's regions but the average London property is still considerably more expensive than properties in other parts of the country.
The fall in transaction levels may well cause prices to start coming down more widely, but, as it stands, London's property market hasn't had the life strangled out of it.
It would appear from these figures that, while the top end of the London property market has cooled to some degree, the rest of the capital is still experiencing solid property price increases.
Where are the most expensive areas for house prices?
