
 Yahoo Finance
 The five-year shareholder returns and company earnings persist lower as S P Setia Berhad (KLSE:SPSETIA) stock falls a further 9.9% in past week
Statistically speaking, long term investing is a profitable endeavour. But that doesn't mean long term investors can avoid big losses. For example, after five long years the S P Setia Berhad (KLSE:SPSETIA) share price is a whole 69% lower. That's not a lot of fun for true believers. Furthermore, it's down 18% in about a quarter. That's not much fun for holders. We note that the company has reported results fairly recently; and the market is hardly delighted. You can check out the latest numbers in our company report.
Given the past week has been tough on shareholders, let's investigate the fundamentals and see what we can learn.
Check out our latest analysis for S P Setia Berhad
While the efficient markets hypothesis continues to be taught by some, it has been proven that markets are over-reactive dynamic systems, and investors are not always rational. By comparing earnings per share (EPS) and share price changes over time, we can get a feel for how investor attitudes to a company have morphed over time.
S P Setia Berhad became profitable within the last five years. That would generally be considered a positive, so we are surprised to see the share price is down. Other metrics may better explain the share price move.
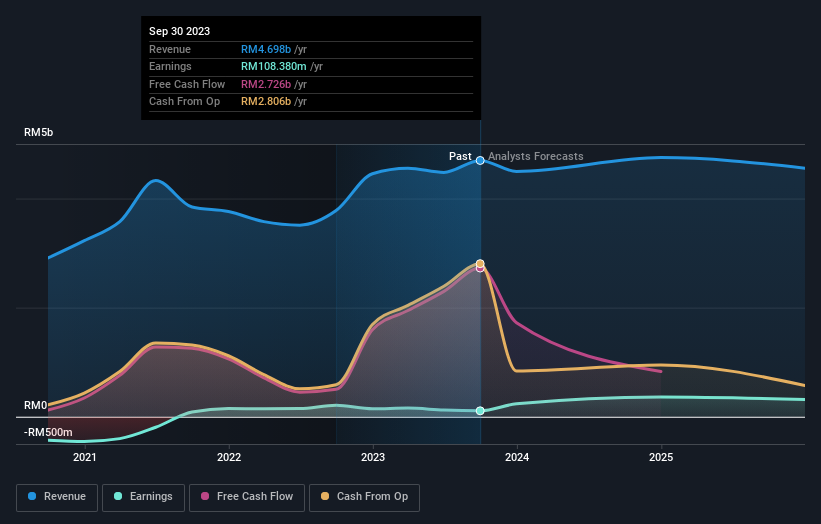
In contrast to the share price, revenue has actually increased by 3.3% a year in the five year period. A more detailed examination of the revenue and earnings may or may not explain why the share price languishes; there could be an opportunity.
The image below shows how earnings and revenue have tracked over time (if you click on the image you can see greater detail).
S P Setia Berhad is a well known stock, with plenty of analyst coverage, suggesting some visibility into future growth. Given we have quite a good number of analyst forecasts, it might be well worth checking out this free chart depicting consensus estimates.
A Different Perspective
It's good to see that S P Setia Berhad has rewarded shareholders with a total shareholder return of 6.1% in the last twelve months. And that does include the dividend. Notably the five-year annualised TSR loss of 11% per year compares very unfavourably with the recent share price performance. The long term loss makes us cautious, but the short term TSR gain certainly hints at a brighter future. I find it very interesting to look at share price over the long term as a proxy for business performance. But to truly gain insight, we need to consider other information, too. For instance, we've identified 3 warning signs for S P Setia Berhad (1 is a bit unpleasant) that you should be aware of.
Of course S P Setia Berhad may not be the best stock to buy. So you may wish to see this free collection of growth stocks.
Please note, the market returns quoted in this article reflect the market weighted average returns of stocks that currently trade on Malaysian exchanges.
Have feedback on this article? Concerned about the content? Get in touch with us directly. Alternatively, email editorial-team (at) simplywallst.com.
This article by Simply Wall St is general in nature. We provide commentary based on historical data and analyst forecasts only using an unbiased methodology and our articles are not intended to be financial advice. It does not constitute a recommendation to buy or sell any stock, and does not take account of your objectives, or your financial situation. We aim to bring you long-term focused analysis driven by fundamental data. Note that our analysis may not factor in the latest price-sensitive company announcements or qualitative material. Simply Wall St has no position in any stocks mentioned.
