
 Yahoo Finance
 The five-year shareholder returns and company earnings persist lower as Fresenius Medical Care KGaA (ETR:FME) stock falls a further 5.3% in past week
We think intelligent long term investing is the way to go. But that doesn't mean long term investors can avoid big losses. For example, after five long years the Fresenius Medical Care AG & Co. KGaA (ETR:FME) share price is a whole 55% lower. That is extremely sub-optimal, to say the least. Unfortunately the share price momentum is still quite negative, with prices down 12% in thirty days.
With the stock having lost 5.3% in the past week, it's worth taking a look at business performance and seeing if there's any red flags.
Check out our latest analysis for Fresenius Medical Care KGaA
There is no denying that markets are sometimes efficient, but prices do not always reflect underlying business performance. One flawed but reasonable way to assess how sentiment around a company has changed is to compare the earnings per share (EPS) with the share price.
Looking back five years, both Fresenius Medical Care KGaA's share price and EPS declined; the latter at a rate of 21% per year. The share price decline of 15% per year isn't as bad as the EPS decline. So the market may previously have expected a drop, or else it expects the situation will improve.
You can see below how EPS has changed over time (discover the exact values by clicking on the image).
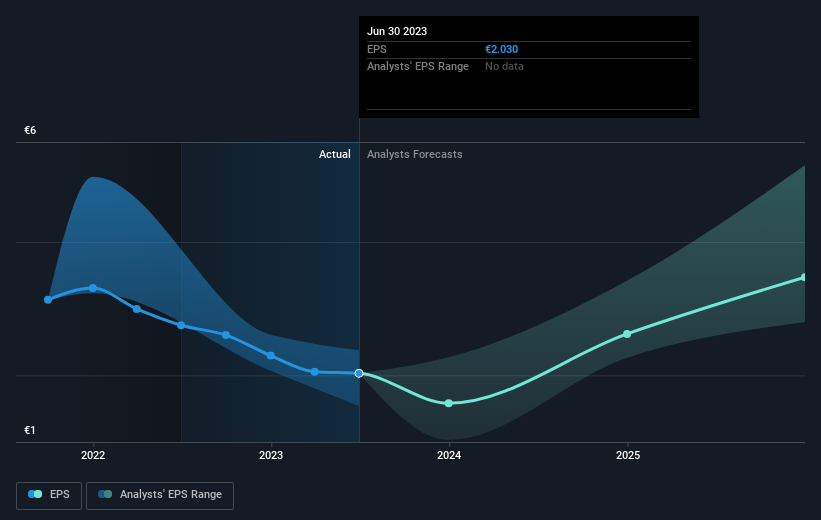
It might be well worthwhile taking a look at our free report on Fresenius Medical Care KGaA's earnings, revenue and cash flow.
What About Dividends?
As well as measuring the share price return, investors should also consider the total shareholder return (TSR). Whereas the share price return only reflects the change in the share price, the TSR includes the value of dividends (assuming they were reinvested) and the benefit of any discounted capital raising or spin-off. It's fair to say that the TSR gives a more complete picture for stocks that pay a dividend. As it happens, Fresenius Medical Care KGaA's TSR for the last 5 years was -50%, which exceeds the share price return mentioned earlier. And there's no prize for guessing that the dividend payments largely explain the divergence!
A Different Perspective
It's good to see that Fresenius Medical Care KGaA has rewarded shareholders with a total shareholder return of 41% in the last twelve months. That's including the dividend. That certainly beats the loss of about 9% per year over the last half decade. We generally put more weight on the long term performance over the short term, but the recent improvement could hint at a (positive) inflection point within the business. I find it very interesting to look at share price over the long term as a proxy for business performance. But to truly gain insight, we need to consider other information, too. Take risks, for example - Fresenius Medical Care KGaA has 2 warning signs we think you should be aware of.
If you like to buy stocks alongside management, then you might just love this free list of companies. (Hint: insiders have been buying them).
Please note, the market returns quoted in this article reflect the market weighted average returns of stocks that currently trade on German exchanges.
Have feedback on this article? Concerned about the content? Get in touch with us directly. Alternatively, email editorial-team (at) simplywallst.com.
This article by Simply Wall St is general in nature. We provide commentary based on historical data and analyst forecasts only using an unbiased methodology and our articles are not intended to be financial advice. It does not constitute a recommendation to buy or sell any stock, and does not take account of your objectives, or your financial situation. We aim to bring you long-term focused analysis driven by fundamental data. Note that our analysis may not factor in the latest price-sensitive company announcements or qualitative material. Simply Wall St has no position in any stocks mentioned.
