
 Yahoo Finance
 The five-year shareholder returns and company earnings persist lower as Nordstrom (NYSE:JWN) stock falls a further 6.3% in past week
We think intelligent long term investing is the way to go. But unfortunately, some companies simply don't succeed. Zooming in on an example, the Nordstrom, Inc. (NYSE:JWN) share price dropped 66% in the last half decade. We certainly feel for shareholders who bought near the top. Even worse, it's down 23% in about a month, which isn't fun at all. Importantly, this could be a market reaction to the recently released financial results. You can check out the latest numbers in our company report.
Given the past week has been tough on shareholders, let's investigate the fundamentals and see what we can learn.
Check out our latest analysis for Nordstrom
There is no denying that markets are sometimes efficient, but prices do not always reflect underlying business performance. One flawed but reasonable way to assess how sentiment around a company has changed is to compare the earnings per share (EPS) with the share price.
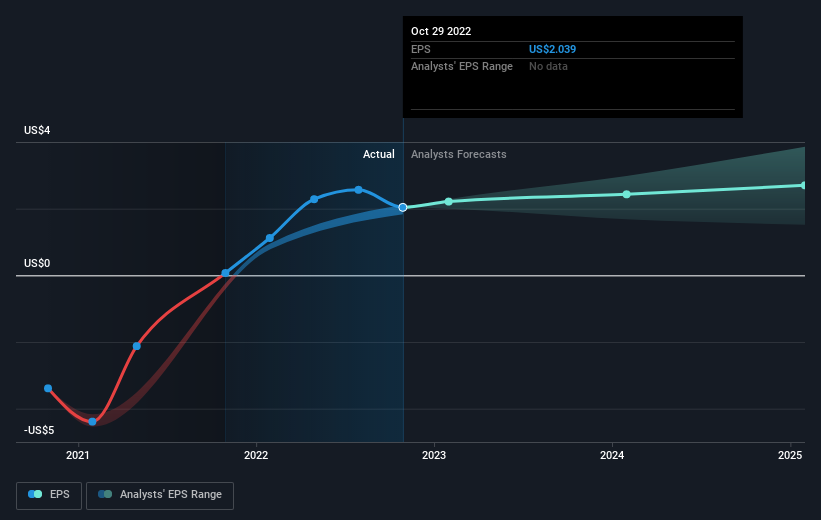
Looking back five years, both Nordstrom's share price and EPS declined; the latter at a rate of 6.8% per year. Readers should note that the share price has fallen faster than the EPS, at a rate of 19% per year, over the period. This implies that the market is more cautious about the business these days. The low P/E ratio of 8.09 further reflects this reticence.
You can see how EPS has changed over time in the image below (click on the chart to see the exact values).
We know that Nordstrom has improved its bottom line lately, but is it going to grow revenue? Check if analysts think Nordstrom will grow revenue in the future.
What About Dividends?
It is important to consider the total shareholder return, as well as the share price return, for any given stock. The TSR is a return calculation that accounts for the value of cash dividends (assuming that any dividend received was reinvested) and the calculated value of any discounted capital raisings and spin-offs. Arguably, the TSR gives a more comprehensive picture of the return generated by a stock. We note that for Nordstrom the TSR over the last 5 years was -61%, which is better than the share price return mentioned above. The dividends paid by the company have thusly boosted the total shareholder return.
A Different Perspective
The total return of 20% received by Nordstrom shareholders over the last year isn't far from the market return of -21%. So last year was actually even worse than the last five years, which cost shareholders 10% per year. It will probably take a substantial improvement in the fundamental performance for the company to reverse this trend. It's always interesting to track share price performance over the longer term. But to understand Nordstrom better, we need to consider many other factors. For instance, we've identified 2 warning signs for Nordstrom that you should be aware of.
If you would prefer to check out another company -- one with potentially superior financials -- then do not miss this free list of companies that have proven they can grow earnings.
Please note, the market returns quoted in this article reflect the market weighted average returns of stocks that currently trade on US exchanges.
Have feedback on this article? Concerned about the content? Get in touch with us directly. Alternatively, email editorial-team (at) simplywallst.com.
This article by Simply Wall St is general in nature. We provide commentary based on historical data and analyst forecasts only using an unbiased methodology and our articles are not intended to be financial advice. It does not constitute a recommendation to buy or sell any stock, and does not take account of your objectives, or your financial situation. We aim to bring you long-term focused analysis driven by fundamental data. Note that our analysis may not factor in the latest price-sensitive company announcements or qualitative material. Simply Wall St has no position in any stocks mentioned.
Join A Paid User Research Session
You’ll receive a US$30 Amazon Gift card for 1 hour of your time while helping us build better investing tools for the individual investors like yourself. Sign up here
