
 Yahoo Finance
 The five-year underlying earnings growth at BT Group (LON:BT.A) is promising, but the shareholders are still in the red over that time
Ideally, your overall portfolio should beat the market average. But every investor is virtually certain to have both over-performing and under-performing stocks. So we wouldn't blame long term BT Group plc (LON:BT.A) shareholders for doubting their decision to hold, with the stock down 48% over a half decade. Shareholders have had an even rougher run lately, with the share price down 21% in the last 90 days.
With the stock having lost 3.3% in the past week, it's worth taking a look at business performance and seeing if there's any red flags.
Check out our latest analysis for BT Group
While the efficient markets hypothesis continues to be taught by some, it has been proven that markets are over-reactive dynamic systems, and investors are not always rational. By comparing earnings per share (EPS) and share price changes over time, we can get a feel for how investor attitudes to a company have morphed over time.
While the share price declined over five years, BT Group actually managed to increase EPS by an average of 1.3% per year. So it doesn't seem like EPS is a great guide to understanding how the market is valuing the stock. Alternatively, growth expectations may have been unreasonable in the past.
Based on these numbers, we'd venture that the market may have been over-optimistic about forecast growth, half a decade ago. Having said that, we might get a better idea of what's going on with the stock by looking at other metrics.
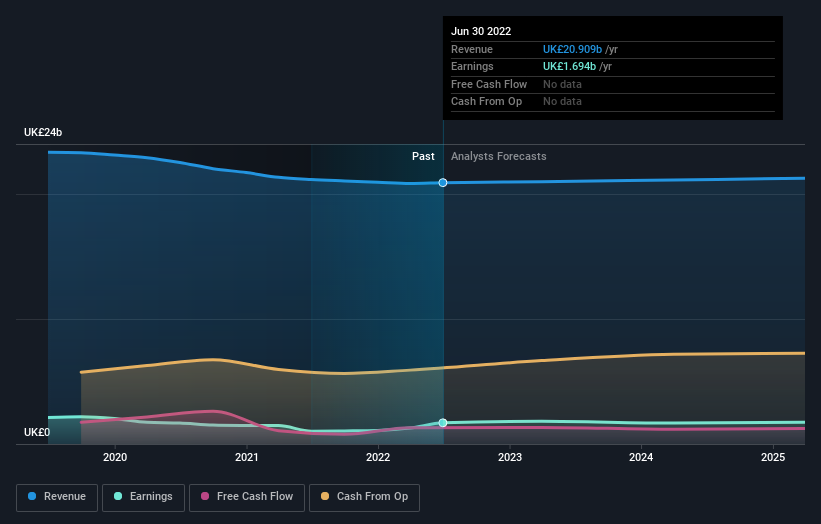
The most recent dividend was actually lower than it was in the past, so that may have sent the share price lower. The revenue decline of about 3.3% per year might also encourage sellers.
You can see how earnings and revenue have changed over time in the image below (click on the chart to see the exact values).
BT Group is a well known stock, with plenty of analyst coverage, suggesting some visibility into future growth. Given we have quite a good number of analyst forecasts, it might be well worth checking out this free chart depicting consensus estimates.
What About Dividends?
As well as measuring the share price return, investors should also consider the total shareholder return (TSR). Whereas the share price return only reflects the change in the share price, the TSR includes the value of dividends (assuming they were reinvested) and the benefit of any discounted capital raising or spin-off. It's fair to say that the TSR gives a more complete picture for stocks that pay a dividend. As it happens, BT Group's TSR for the last 5 years was -36%, which exceeds the share price return mentioned earlier. And there's no prize for guessing that the dividend payments largely explain the divergence!
A Different Perspective
While it's never nice to take a loss, BT Group shareholders can take comfort that , including dividends,their trailing twelve month loss of 5.2% wasn't as bad as the market loss of around 8.9%. Of far more concern is the 6% p.a. loss served to shareholders over the last five years. This sort of share price action isn't particularly encouraging, but at least the losses are slowing. It's always interesting to track share price performance over the longer term. But to understand BT Group better, we need to consider many other factors. Case in point: We've spotted 3 warning signs for BT Group you should be aware of, and 1 of them is a bit unpleasant.
If you would prefer to check out another company -- one with potentially superior financials -- then do not miss this free list of companies that have proven they can grow earnings.
Please note, the market returns quoted in this article reflect the market weighted average returns of stocks that currently trade on GB exchanges.
Have feedback on this article? Concerned about the content? Get in touch with us directly. Alternatively, email editorial-team (at) simplywallst.com.
This article by Simply Wall St is general in nature. We provide commentary based on historical data and analyst forecasts only using an unbiased methodology and our articles are not intended to be financial advice. It does not constitute a recommendation to buy or sell any stock, and does not take account of your objectives, or your financial situation. We aim to bring you long-term focused analysis driven by fundamental data. Note that our analysis may not factor in the latest price-sensitive company announcements or qualitative material. Simply Wall St has no position in any stocks mentioned.
Join A Paid User Research Session
You’ll receive a US$30 Amazon Gift card for 1 hour of your time while helping us build better investing tools for the individual investors like yourself. Sign up here
