
 Yahoo Finance
 The five-year underlying earnings growth at Hain Celestial Group (NASDAQ:HAIN) is promising, but the shareholders are still in the red over that time
Statistically speaking, long term investing is a profitable endeavour. But along the way some stocks are going to perform badly. Zooming in on an example, the The Hain Celestial Group, Inc. (NASDAQ:HAIN) share price dropped 55% in the last half decade. That is extremely sub-optimal, to say the least. And we doubt long term believers are the only worried holders, since the stock price has declined 53% over the last twelve months.
Since Hain Celestial Group has shed US$96m from its value in the past 7 days, let's see if the longer term decline has been driven by the business' economics.
See our latest analysis for Hain Celestial Group
While markets are a powerful pricing mechanism, share prices reflect investor sentiment, not just underlying business performance. By comparing earnings per share (EPS) and share price changes over time, we can get a feel for how investor attitudes to a company have morphed over time.
Hain Celestial Group became profitable within the last five years. That would generally be considered a positive, so we are surprised to see the share price is down. Other metrics might give us a better handle on how its value is changing over time.
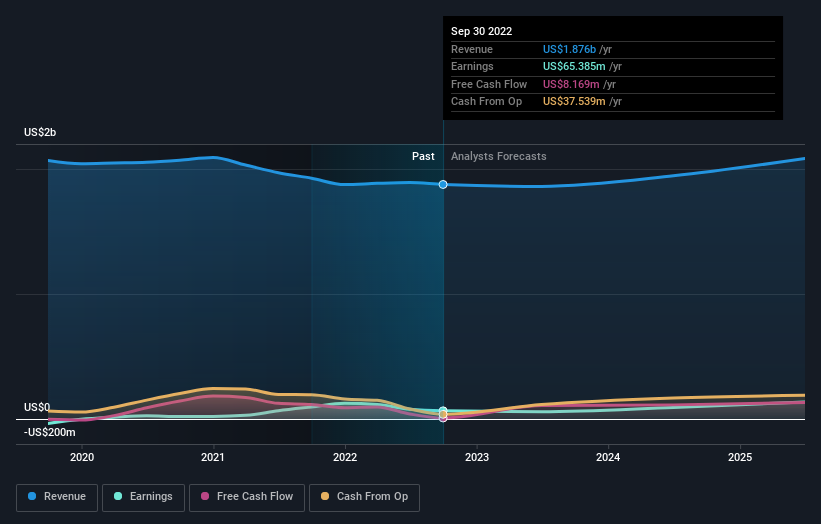
It could be that the revenue decline of 5.1% per year is viewed as evidence that Hain Celestial Group is shrinking. This has probably encouraged some shareholders to sell down the stock.
The graphic below depicts how earnings and revenue have changed over time (unveil the exact values by clicking on the image).
Hain Celestial Group is well known by investors, and plenty of clever analysts have tried to predict the future profit levels. If you are thinking of buying or selling Hain Celestial Group stock, you should check out this free report showing analyst consensus estimates for future profits.
A Different Perspective
While the broader market lost about 18% in the twelve months, Hain Celestial Group shareholders did even worse, losing 53%. Having said that, it's inevitable that some stocks will be oversold in a falling market. The key is to keep your eyes on the fundamental developments. Unfortunately, last year's performance may indicate unresolved challenges, given that it was worse than the annualised loss of 9% over the last half decade. We realise that Baron Rothschild has said investors should "buy when there is blood on the streets", but we caution that investors should first be sure they are buying a high quality business. I find it very interesting to look at share price over the long term as a proxy for business performance. But to truly gain insight, we need to consider other information, too. Even so, be aware that Hain Celestial Group is showing 2 warning signs in our investment analysis , and 1 of those can't be ignored...
If you are like me, then you will not want to miss this free list of growing companies that insiders are buying.
Please note, the market returns quoted in this article reflect the market weighted average returns of stocks that currently trade on US exchanges.
Have feedback on this article? Concerned about the content? Get in touch with us directly. Alternatively, email editorial-team (at) simplywallst.com.
This article by Simply Wall St is general in nature. We provide commentary based on historical data and analyst forecasts only using an unbiased methodology and our articles are not intended to be financial advice. It does not constitute a recommendation to buy or sell any stock, and does not take account of your objectives, or your financial situation. We aim to bring you long-term focused analysis driven by fundamental data. Note that our analysis may not factor in the latest price-sensitive company announcements or qualitative material. Simply Wall St has no position in any stocks mentioned.
Join A Paid User Research Session
You’ll receive a US$30 Amazon Gift card for 1 hour of your time while helping us build better investing tools for the individual investors like yourself. Sign up here
