
 Yahoo Finance
 Fix Price Group PLC's (LON:FIXP) Been Flat But Financials Look Strong: Can The Market Catch Up?
It is easy to overlook Fix Price Group's (LON:FIXP) given its unimpressive and roughly flat price performance over the past three months. Regardless, it's worth giving the company a closer given that its key financial performance indicators look pretty strong and that's usually rewarded by the markets in the long-run. Particularly, we will be paying attention to Fix Price Group's ROE today.
Return on Equity or ROE is a test of how effectively a company is growing its value and managing investors’ money. In simpler terms, it measures the profitability of a company in relation to shareholder's equity.
See our latest analysis for Fix Price Group
How To Calculate Return On Equity?
The formula for return on equity is:
Return on Equity = Net Profit (from continuing operations) ÷ Shareholders' Equity
So, based on the above formula, the ROE for Fix Price Group is:
74% = ₽36b ÷ ₽49b (Based on the trailing twelve months to September 2023).
The 'return' is the amount earned after tax over the last twelve months. One way to conceptualize this is that for each $1 of shareholders' capital it has, the company made $0.74 in profit.
What Has ROE Got To Do With Earnings Growth?
Thus far, we have learned that ROE measures how efficiently a company is generating its profits. Based on how much of its profits the company chooses to reinvest or "retain", we are then able to evaluate a company's future ability to generate profits. Assuming all else is equal, companies that have both a higher return on equity and higher profit retention are usually the ones that have a higher growth rate when compared to companies that don't have the same features.
A Side By Side comparison of Fix Price Group's Earnings Growth And 74% ROE
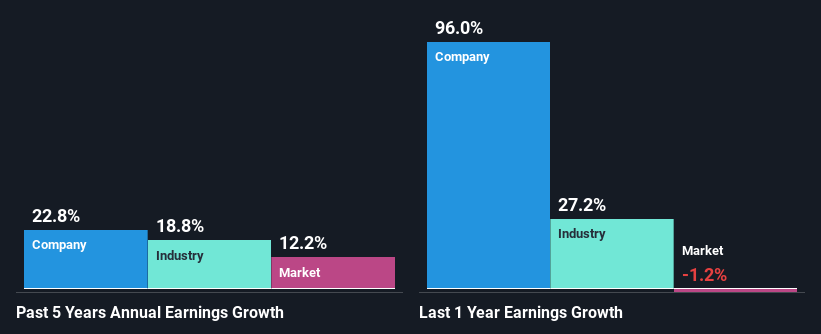
Firstly, we acknowledge that Fix Price Group has a significantly high ROE. Second, a comparison with the average ROE reported by the industry of 14% also doesn't go unnoticed by us. Under the circumstances, Fix Price Group's considerable five year net income growth of 23% was to be expected.
We then compared Fix Price Group's net income growth with the industry and we're pleased to see that the company's growth figure is higher when compared with the industry which has a growth rate of 19% in the same 5-year period.
Earnings growth is an important metric to consider when valuing a stock. The investor should try to establish if the expected growth or decline in earnings, whichever the case may be, is priced in. This then helps them determine if the stock is placed for a bright or bleak future. If you're wondering about Fix Price Group's's valuation, check out this gauge of its price-to-earnings ratio, as compared to its industry.
Is Fix Price Group Using Its Retained Earnings Effectively?
While the company did pay out a portion of its dividend in the past, it currently doesn't pay a dividend. This is likely what's driving the high earnings growth number discussed above.
Summary
Overall, we are quite pleased with Fix Price Group's performance. Particularly, we like that the company is reinvesting heavily into its business, and at a high rate of return. Unsurprisingly, this has led to an impressive earnings growth. That being so, a study of the latest analyst forecasts show that the company is expected to see a slowdown in its future earnings growth. To know more about the company's future earnings growth forecasts take a look at this free report on analyst forecasts for the company to find out more.
Have feedback on this article? Concerned about the content? Get in touch with us directly. Alternatively, email editorial-team (at) simplywallst.com.
This article by Simply Wall St is general in nature. We provide commentary based on historical data and analyst forecasts only using an unbiased methodology and our articles are not intended to be financial advice. It does not constitute a recommendation to buy or sell any stock, and does not take account of your objectives, or your financial situation. We aim to bring you long-term focused analysis driven by fundamental data. Note that our analysis may not factor in the latest price-sensitive company announcements or qualitative material. Simply Wall St has no position in any stocks mentioned.
