
 Yahoo Finance
 What Is Fjord1's (OB:FJORD) P/E Ratio After Its Share Price Rocketed?

Fjord1 (OB:FJORD) shareholders are no doubt pleased to see that the share price has had a great month, posting a 31% gain, recovering from prior weakness. However, the annual gain of 4.8% wasn't so impressive.
Assuming no other changes, a sharply higher share price makes a stock less attractive to potential buyers. In the long term, share prices tend to follow earnings per share, but in the short term prices bounce around in response to short term factors (which are not always obvious). The implication here is that deep value investors might steer clear when expectations of a company are too high. One way to gauge market expectations of a stock is to look at its Price to Earnings Ratio (PE Ratio). Investors have optimistic expectations of companies with higher P/E ratios, compared to companies with lower P/E ratios.
Check out our latest analysis for Fjord1
How Does Fjord1's P/E Ratio Compare To Its Peers?
We can tell from its P/E ratio of 21.07 that there is some investor optimism about Fjord1. As you can see below, Fjord1 has a higher P/E than the average company (14.4) in the shipping industry.
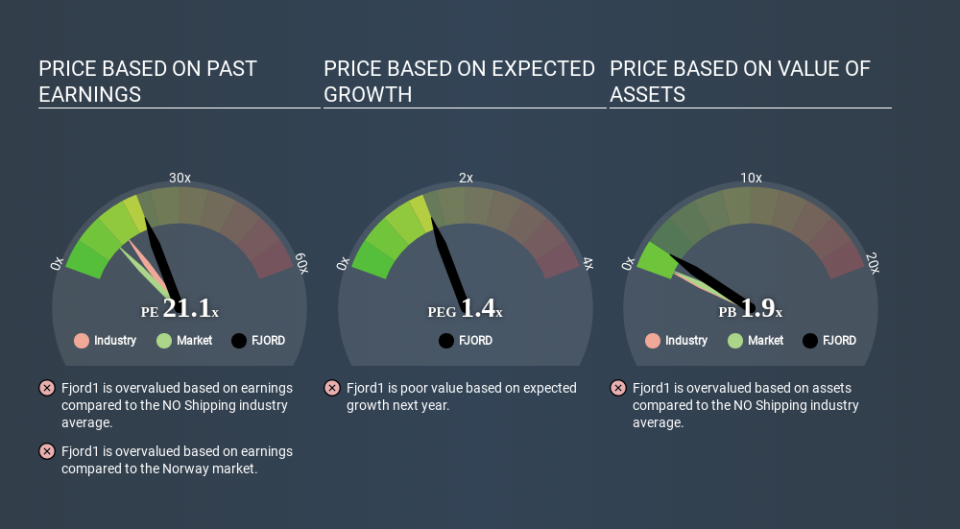
That means that the market expects Fjord1 will outperform other companies in its industry. Shareholders are clearly optimistic, but the future is always uncertain. So further research is always essential. I often monitor director buying and selling.
How Growth Rates Impact P/E Ratios
When earnings fall, the 'E' decreases, over time. Therefore, even if you pay a low multiple of earnings now, that multiple will become higher in the future. Then, a higher P/E might scare off shareholders, pushing the share price down.
Fjord1 saw earnings per share decrease by 61% last year. But over the longer term (5 years) earnings per share have increased by 17%. And it has shrunk its earnings per share by 23% per year over the last three years. This growth rate might warrant a low P/E ratio.
Remember: P/E Ratios Don't Consider The Balance Sheet
It's important to note that the P/E ratio considers the market capitalization, not the enterprise value. In other words, it does not consider any debt or cash that the company may have on the balance sheet. Hypothetically, a company could reduce its future P/E ratio by spending its cash (or taking on debt) to achieve higher earnings.
While growth expenditure doesn't always pay off, the point is that it is a good option to have; but one that the P/E ratio ignores.
So What Does Fjord1's Balance Sheet Tell Us?
Net debt totals a substantial 111% of Fjord1's market cap. This is a relatively high level of debt, so the stock probably deserves a relatively low P/E ratio. Keep that in mind when comparing it to other companies.
The Bottom Line On Fjord1's P/E Ratio
Fjord1 has a P/E of 21.1. That's higher than the average in its market, which is 11.3. With meaningful debt and a lack of recent earnings growth, the market has high expectations that the business will earn more in the future. What is very clear is that the market has become more optimistic about Fjord1 over the last month, with the P/E ratio rising from 16.1 back then to 21.1 today. For those who prefer to invest with the flow of momentum, that might mean it's time to put the stock on a watchlist, or research it. But the contrarian may see it as a missed opportunity.
Investors have an opportunity when market expectations about a stock are wrong. People often underestimate remarkable growth -- so investors can make money when fast growth is not fully appreciated. So this free visualization of the analyst consensus on future earnings could help you make the right decision about whether to buy, sell, or hold.
Of course you might be able to find a better stock than Fjord1. So you may wish to see this free collection of other companies that have grown earnings strongly.
If you spot an error that warrants correction, please contact the editor at editorial-team@simplywallst.com. This article by Simply Wall St is general in nature. It does not constitute a recommendation to buy or sell any stock, and does not take account of your objectives, or your financial situation. Simply Wall St has no position in the stocks mentioned.
We aim to bring you long-term focused research analysis driven by fundamental data. Note that our analysis may not factor in the latest price-sensitive company announcements or qualitative material. Thank you for reading.
