
 Yahoo Finance
 Flowserve (NYSE:FLS) Has More To Do To Multiply In Value Going Forward
What are the early trends we should look for to identify a stock that could multiply in value over the long term? Firstly, we'd want to identify a growing return on capital employed (ROCE) and then alongside that, an ever-increasing base of capital employed. Ultimately, this demonstrates that it's a business that is reinvesting profits at increasing rates of return. Having said that, from a first glance at Flowserve (NYSE:FLS) we aren't jumping out of our chairs at how returns are trending, but let's have a deeper look.
What Is Return On Capital Employed (ROCE)?
Just to clarify if you're unsure, ROCE is a metric for evaluating how much pre-tax income (in percentage terms) a company earns on the capital invested in its business. Analysts use this formula to calculate it for Flowserve:
Return on Capital Employed = Earnings Before Interest and Tax (EBIT) ÷ (Total Assets - Current Liabilities)
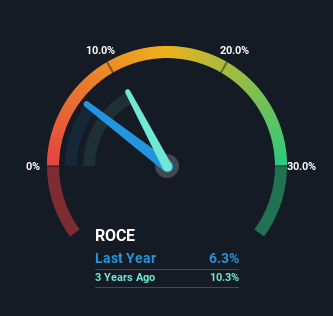
0.063 = US$222m ÷ (US$4.8b - US$1.2b) (Based on the trailing twelve months to December 2022).
Therefore, Flowserve has an ROCE of 6.3%. In absolute terms, that's a low return and it also under-performs the Machinery industry average of 11%.
Check out our latest analysis for Flowserve
In the above chart we have measured Flowserve's prior ROCE against its prior performance, but the future is arguably more important. If you'd like to see what analysts are forecasting going forward, you should check out our free report for Flowserve.
How Are Returns Trending?
There hasn't been much to report for Flowserve's returns and its level of capital employed because both metrics have been steady for the past five years. It's not uncommon to see this when looking at a mature and stable business that isn't re-investing its earnings because it has likely passed that phase of the business cycle. So unless we see a substantial change at Flowserve in terms of ROCE and additional investments being made, we wouldn't hold our breath on it being a multi-bagger. This probably explains why Flowserve is paying out 35% of its income to shareholders in the form of dividends. Unless businesses have highly compelling growth opportunities, they'll typically return some money to shareholders.
Our Take On Flowserve's ROCE
In a nutshell, Flowserve has been trudging along with the same returns from the same amount of capital over the last five years. Since the stock has declined 21% over the last five years, investors may not be too optimistic on this trend improving either. Therefore based on the analysis done in this article, we don't think Flowserve has the makings of a multi-bagger.
One more thing: We've identified 3 warning signs with Flowserve (at least 1 which can't be ignored) , and understanding them would certainly be useful.
If you want to search for solid companies with great earnings, check out this free list of companies with good balance sheets and impressive returns on equity.
Have feedback on this article? Concerned about the content? Get in touch with us directly. Alternatively, email editorial-team (at) simplywallst.com.
This article by Simply Wall St is general in nature. We provide commentary based on historical data and analyst forecasts only using an unbiased methodology and our articles are not intended to be financial advice. It does not constitute a recommendation to buy or sell any stock, and does not take account of your objectives, or your financial situation. We aim to bring you long-term focused analysis driven by fundamental data. Note that our analysis may not factor in the latest price-sensitive company announcements or qualitative material. Simply Wall St has no position in any stocks mentioned.
Join A Paid User Research Session
You’ll receive a US$30 Amazon Gift card for 1 hour of your time while helping us build better investing tools for the individual investors like yourself. Sign up here
