
 Yahoo Finance
 Is Fly Leasing Limited’s (NYSE:FLY) Return On Capital Employed Any Good?

Today we'll look at Fly Leasing Limited (NYSE:FLY) and reflect on its potential as an investment. Specifically, we'll consider its Return On Capital Employed (ROCE), since that will give us an insight into how efficiently the business can generate profits from the capital it requires.
Firstly, we'll go over how we calculate ROCE. Then we'll compare its ROCE to similar companies. And finally, we'll look at how its current liabilities are impacting its ROCE.
What is Return On Capital Employed (ROCE)?
ROCE measures the amount of pre-tax profits a company can generate from the capital employed in its business. Generally speaking a higher ROCE is better. Ultimately, it is a useful but imperfect metric. Author Edwin Whiting says to be careful when comparing the ROCE of different businesses, since 'No two businesses are exactly alike.
So, How Do We Calculate ROCE?
The formula for calculating the return on capital employed is:
Return on Capital Employed = Earnings Before Interest and Tax (EBIT) ÷ (Total Assets - Current Liabilities)
Or for Fly Leasing:
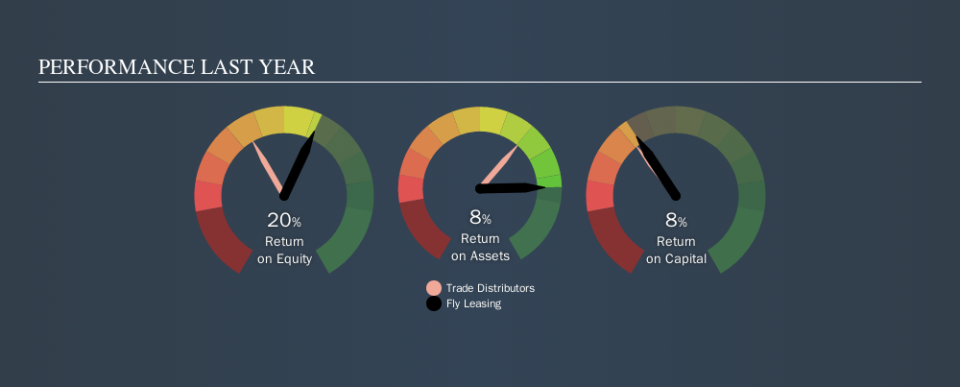
0.08 = US$313m ÷ (US$3.9b - US$23m) (Based on the trailing twelve months to June 2019.)
So, Fly Leasing has an ROCE of 8.0%.
View our latest analysis for Fly Leasing
Is Fly Leasing's ROCE Good?
One way to assess ROCE is to compare similar companies. We can see Fly Leasing's ROCE is around the 8.8% average reported by the Trade Distributors industry. Separate from how Fly Leasing stacks up against its industry, its ROCE in absolute terms is mediocre; relative to the returns on government bonds. It is possible that there are more rewarding investments out there.
You can click on the image below to see (in greater detail) how Fly Leasing's past growth compares to other companies.
It is important to remember that ROCE shows past performance, and is not necessarily predictive. Companies in cyclical industries can be difficult to understand using ROCE, as returns typically look high during boom times, and low during busts. This is because ROCE only looks at one year, instead of considering returns across a whole cycle. Since the future is so important for investors, you should check out our free report on analyst forecasts for Fly Leasing.
Do Fly Leasing's Current Liabilities Skew Its ROCE?
Current liabilities include invoices, such as supplier payments, short-term debt, or a tax bill, that need to be paid within 12 months. The ROCE equation subtracts current liabilities from capital employed, so a company with a lot of current liabilities appears to have less capital employed, and a higher ROCE than otherwise. To counteract this, we check if a company has high current liabilities, relative to its total assets.
Fly Leasing has total liabilities of US$23m and total assets of US$3.9b. As a result, its current liabilities are equal to approximately 0.6% of its total assets. Fly Leasing has a low level of current liabilities, which have a minimal impact on its uninspiring ROCE.
What We Can Learn From Fly Leasing's ROCE
If performance improves, then Fly Leasing may be an OK investment, especially at the right valuation. Of course, you might also be able to find a better stock than Fly Leasing. So you may wish to see this free collection of other companies that have grown earnings strongly.
If you like to buy stocks alongside management, then you might just love this free list of companies. (Hint: insiders have been buying them).
We aim to bring you long-term focused research analysis driven by fundamental data. Note that our analysis may not factor in the latest price-sensitive company announcements or qualitative material.
If you spot an error that warrants correction, please contact the editor at editorial-team@simplywallst.com. This article by Simply Wall St is general in nature. It does not constitute a recommendation to buy or sell any stock, and does not take account of your objectives, or your financial situation. Simply Wall St has no position in the stocks mentioned. Thank you for reading.
