
 Yahoo Finance
 FMC Corp's (FMC) Q1 Earnings Top Estimates, Revenues Miss
FMC Corporation FMC recorded earnings (as reported) of $1.58 per share in first-quarter 2020, down from $1.62 reported a year ago.
Barring one-time items, adjusted earnings per share came in at $1.84, topping the Zacks Consensus Estimate of $1.81.
Revenues were $1,250 million for the quarter, up around 5% from the year-ago quarter. It lagged the Zacks Consensus Estimate of $1,251.4 million.
Revenue growth was supported by 7% contribution from volume and 2% contribution from pricing, partly offset by a 4% unfavorable impact of currencies. The company saw growth across Latin America, North America and EMEA (Europe, Middle East, and Africa).
FMC Corporation Price, Consensus and EPS Surprise
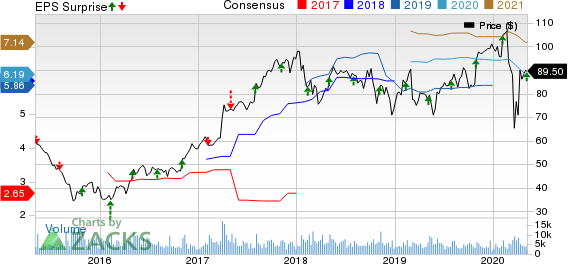
FMC Corporation price-consensus-eps-surprise-chart | FMC Corporation Quote
Regional Sales Performance
Sales in Latin America rose 26% year over year in the reported quarter driven by broad-based volume gains.
Sales went up 3% year over year in North America, supported by higher demand for Rynaxypyr insect control and new products.
In EMEA, sales rose 1% year over year. This was driven by strong demand for fungicides and growth in herbicides.
Revenues fell 3% year over year in Asia, impacted by currency headwinds and product rationalizations that more than offset double-digit growth in India and Pakistan.
Financials
The company had cash and cash equivalents of $436.2 million at the end of the quarter, a roughly four-fold year-over-year increase. Long-term debt was $3,531.8 million at the end of the quarter, up 65% year over year.
Guidance
For 2020, FMC sees revenues to be between $4.65 billion and $4.85 billion, indicating a rise of 3% at the midpoint versus 2019.
The company also expects adjusted earnings per share in the range of $6.05-$6.70. The guidance reflects an increase of 5% at the midpoint compared with 2019.
Moreover, FMC envisions adjusted EBITDA of $1.23-$1.34 billion for 2020, indicating 5% growth at the midpoint versus 2019.
For second-quarter 2020, revenues are projected in the band of $1.17-$1.23 billion, flat at the midpoint compared with second-quarter 2019. Adjusted earnings are forecast in the range of $1.58-$1.74 per share, also flat at the midpoint compared with second-quarter 2019 figure.
Price Performance
FMC’s shares are down 10.3% year to date against the industry’s 28.2% decline.

Zacks Rank & Key Picks
FMC currently carries a Zacks Rank #3 (Hold).
Better-ranked stocks worth considering in the basic materials space are The Scotts Miracle-Gro Company SMG, Franco-Nevada Corporation FNV and Newmont Corporation NEM.
Scotts Miracle-Gro has an expected earnings growth rate of 15.9% for the current fiscal year. The company’s shares have gained roughly 44% in the past year. It currently carries a Zacks Rank #1 (Strong Buy). You can see the complete list of today’s Zacks #1 Rank stocks here.
Franco-Nevada has a projected earnings growth rate of 22% for the current year. It currently carries a Zacks Rank #2 (Buy). The company’s shares have surged roughly 105% in a year.
Newmont has a projected earnings growth rate of 95.5% for the current year. The company’s shares have rallied around 111% in a year. It currently has a Zacks Rank #2.
Today's Best Stocks from Zacks
Would you like to see the updated picks from our best market-beating strategies? From 2017 through 2019, while the S&P 500 gained and impressive +53.6%, five of our strategies returned +65.8%, +97.1%, +118.0%, +175.7% and even +186.7%.
This outperformance has not just been a recent phenomenon. From 2000 – 2019, while the S&P averaged +6.0% per year, our top strategies averaged up to +54.7% per year.
See their latest picks free >>
Want the latest recommendations from Zacks Investment Research? Today, you can download 7 Best Stocks for the Next 30 Days. Click to get this free report
Newmont Corporation (NEM) : Free Stock Analysis Report
FMC Corporation (FMC) : Free Stock Analysis Report
Franco-Nevada Corporation (FNV) : Free Stock Analysis Report
The Scotts Miracle-Gro Company (SMG) : Free Stock Analysis Report
To read this article on Zacks.com click here.
Zacks Investment Research
