
 Yahoo Finance
 Forafric Global (NASDAQ:AFRI) Will Be Looking To Turn Around Its Returns
What underlying fundamental trends can indicate that a company might be in decline? Typically, we'll see the trend of both return on capital employed (ROCE) declining and this usually coincides with a decreasing amount of capital employed. Trends like this ultimately mean the business is reducing its investments and also earning less on what it has invested. So after we looked into Forafric Global (NASDAQ:AFRI), the trends above didn't look too great.
Return On Capital Employed (ROCE): What is it?
For those that aren't sure what ROCE is, it measures the amount of pre-tax profits a company can generate from the capital employed in its business. To calculate this metric for Forafric Global, this is the formula:
Return on Capital Employed = Earnings Before Interest and Tax (EBIT) ÷ (Total Assets - Current Liabilities)
0.066 = US$6.7m ÷ (US$301m - US$199m) (Based on the trailing twelve months to September 2021).
Thus, Forafric Global has an ROCE of 6.6%. Ultimately, that's a low return and it under-performs the Food industry average of 9.3%.
View our latest analysis for Forafric Global
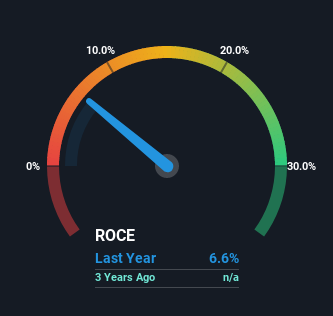
Historical performance is a great place to start when researching a stock so above you can see the gauge for Forafric Global's ROCE against it's prior returns. If you're interested in investigating Forafric Global's past further, check out this free graph of past earnings, revenue and cash flow.
What Does the ROCE Trend For Forafric Global Tell Us?
There is reason to be cautious about Forafric Global, given the returns are trending downwards. Unfortunately the returns on capital have diminished from the 9.5% that they were earning one year ago. Meanwhile, capital employed in the business has stayed roughly the flat over the period. This combination can be indicative of a mature business that still has areas to deploy capital, but the returns received aren't as high due potentially to new competition or smaller margins. If these trends continue, we wouldn't expect Forafric Global to turn into a multi-bagger.
Another thing to note, Forafric Global has a high ratio of current liabilities to total assets of 66%. This effectively means that suppliers (or short-term creditors) are funding a large portion of the business, so just be aware that this can introduce some elements of risk. Ideally we'd like to see this reduce as that would mean fewer obligations bearing risks.
The Bottom Line
All in all, the lower returns from the same amount of capital employed aren't exactly signs of a compounding machine. It should come as no surprise then that the stock has fallen 22% over the last year, so it looks like investors are recognizing these changes. That being the case, unless the underlying trends revert to a more positive trajectory, we'd consider looking elsewhere.
If you'd like to know more about Forafric Global, we've spotted 2 warning signs, and 1 of them shouldn't be ignored.
While Forafric Global may not currently earn the highest returns, we've compiled a list of companies that currently earn more than 25% return on equity. Check out this free list here.
Have feedback on this article? Concerned about the content? Get in touch with us directly. Alternatively, email editorial-team (at) simplywallst.com.
This article by Simply Wall St is general in nature. We provide commentary based on historical data and analyst forecasts only using an unbiased methodology and our articles are not intended to be financial advice. It does not constitute a recommendation to buy or sell any stock, and does not take account of your objectives, or your financial situation. We aim to bring you long-term focused analysis driven by fundamental data. Note that our analysis may not factor in the latest price-sensitive company announcements or qualitative material. Simply Wall St has no position in any stocks mentioned.
