
 Yahoo Finance
 Forex Daily Recap – Rupee Pair Slipped -0.48% over Economic Stimulus Hopes
USD/INR
The Indian Rupee pair plunged more than 0.48% on Friday. In other words, the Indian Rupee currency rose over the US Dollar counterpart. Such an upliftment in the currency came following stimulus expectations from the Modi government in the next two weeks period.

PM Narendra Modi had reviewed the state of the economy and had asked the Finance Minister to provide detailed explanations of the current economic slowdown. Hence, speculations developed, suggesting the Modi v2.0 government to come up with a stimulus package containing New Policy framework, and tax cuts. Meanwhile, traders also focused on the growing Greenback and the rising Foreign Capital Outflows. Recent budget modification for a tax surcharge on the Super-rich had triggered this immediate Foreign Investment withdrawal from India.
On the technical side, the USD/INR had already breached above a major counter trendline, strengthening the bulls. Notably, significant resistances stalled at 71.60, and 71.82 levels were restricting the upside. However, the pair was forming a bearish rising wedge trading pattern since the start of August. Nevertheless, 70.86 and 70.47 support lines remained on the flip side, preventing any potential daily losses.
USD Index
Bulls continued to take over the bears even today. Anyhow, the 78.6% Fibonacci Retracement level confined the pair’s daily gains. Nevertheless, the US Dollar Index was hovering well above the Ichimoku Clouds, pleasing the buyers since last few sessions.
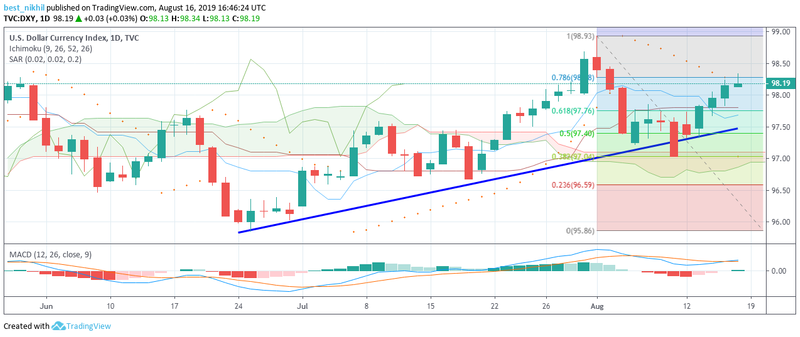
Quite noticeably, the US July Housing data showcased mixed reports on Friday. The July MoM Building Permits recorded 1.336 million over 1.270 million forecasts. On the contrary, the July MoM Housing Starts data published 1.191 million in comparison to the previous 1.241 million. Laterwards, August Michigan Consumer Sentiment Index rose 6.58% over 97.2 points market hopes, reporting 92.1 points.
GBP/USD
Cable continued to keep the overall downtrend intact, staying under the roof of a multi-month old slanting resistance level. Interim, rising odds for a no-deal Brexit was making the Cable traders upset. Latest reports suggested that Germany was ready for a no-deal Brexit and would urge the EU to stay firm over the same stance.

On the other hand, Opposition leader Jeremy Corbyn was struggling with extra efforts to prevent a no-deal Brexit. Recently, Corbyn mentioned openness to use legislation in case of a no-confidence vote failure to bring down the ruling party. Anyhow, the Opposition leader aims for further delay in the exit process rather than a no-deal Brexit on October 31. If at all the pair had made a positive drift then strong resistances stemmed at 1.2185, 1.2485, and 1.2766 levels would have got activated.
EUR/USD
Fiber had recently made an attempt to jump into the upper vicinity of the Bollinger Bands, providing an opportunity to the bulls. Nevertheless, the EUR/USD rebounded below the center line of the Bollinger Bands, sustaining downtrend price actions.
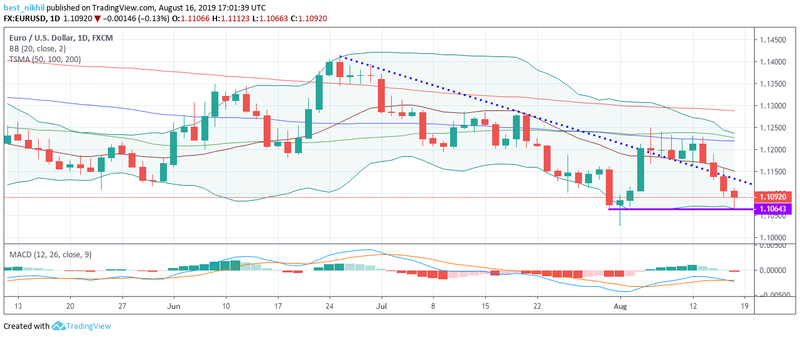
The European economic docket remained quite silent today amid a lack of significant economic events. In the meantime, the June Eurozone Trade Balance came around €20.6 billion over €16.3 billion. Despite that, the downtrend continued to drag down the pair’s accumulated gains. Stable 1.1064 support handle ensured to limit downside. A bearish crossover in the MACD technical indicator guided bear’s further price actions.
This article was originally posted on FX Empire
More From FXEMPIRE:
USD/JPY Weekly Price Forecast – US dollar volatile and positive against Japanese yen
Natural Gas Price Prediction – Prices Reverse Thursday’s Gains Falling Below Resistance
Forex Daily Recap – Rupee Pair Slipped -0.48% over Economic Stimulus Hopes
AUD/USD Weekly Price Forecast – Australian dollar chops for the week
Gold Price Prediction – Gold Prices Consolidate and Close at a 6-year Weekly High
GBP/JPY Weekly Price Forecast – British pound recovers for the week
