
 Yahoo Finance
 freenet's (ETR:FNTN) earnings trajectory could turn positive as the stock advances 4.0% this past week
The main aim of stock picking is to find the market-beating stocks. But the main game is to find enough winners to more than offset the losers So we wouldn't blame long term freenet AG (ETR:FNTN) shareholders for doubting their decision to hold, with the stock down 30% over a half decade. Shareholders have had an even rougher run lately, with the share price down 12% in the last 90 days. But this could be related to the weak market, which is down 8.8% in the same period.
Although the past week has been more reassuring for shareholders, they're still in the red over the last five years, so let's see if the underlying business has been responsible for the decline.
Check out our latest analysis for freenet
There is no denying that markets are sometimes efficient, but prices do not always reflect underlying business performance. By comparing earnings per share (EPS) and share price changes over time, we can get a feel for how investor attitudes to a company have morphed over time.
During the five years over which the share price declined, freenet's earnings per share (EPS) dropped by 4.4% each year. This reduction in EPS is less than the 7% annual reduction in the share price. So it seems the market was too confident about the business, in the past.
You can see how EPS has changed over time in the image below (click on the chart to see the exact values).
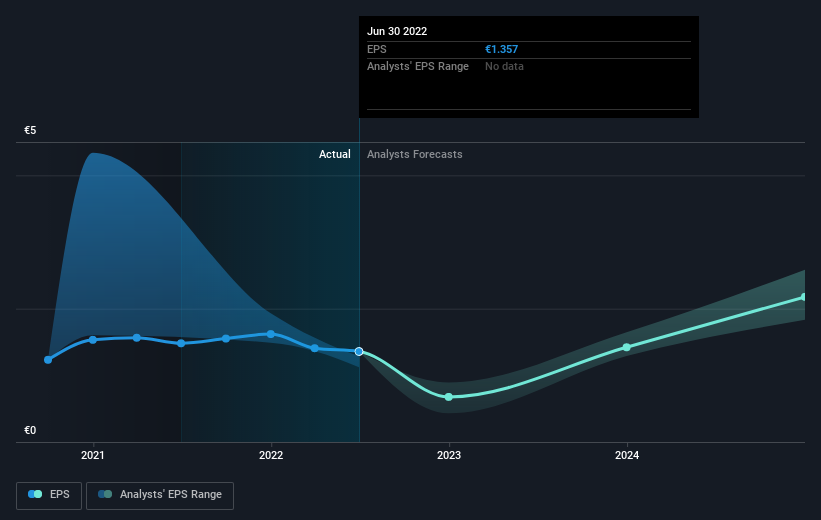
Dive deeper into freenet's key metrics by checking this interactive graph of freenet's earnings, revenue and cash flow.
What About Dividends?
As well as measuring the share price return, investors should also consider the total shareholder return (TSR). The TSR is a return calculation that accounts for the value of cash dividends (assuming that any dividend received was reinvested) and the calculated value of any discounted capital raisings and spin-offs. So for companies that pay a generous dividend, the TSR is often a lot higher than the share price return. As it happens, freenet's TSR for the last 5 years was -7.1%, which exceeds the share price return mentioned earlier. This is largely a result of its dividend payments!
A Different Perspective
Although it hurts that freenet returned a loss of 1.1% in the last twelve months, the broader market was actually worse, returning a loss of 24%. Of far more concern is the 1.4% p.a. loss served to shareholders over the last five years. This sort of share price action isn't particularly encouraging, but at least the losses are slowing. It's always interesting to track share price performance over the longer term. But to understand freenet better, we need to consider many other factors. Case in point: We've spotted 1 warning sign for freenet you should be aware of.
If you like to buy stocks alongside management, then you might just love this free list of companies. (Hint: insiders have been buying them).
Please note, the market returns quoted in this article reflect the market weighted average returns of stocks that currently trade on DE exchanges.
Have feedback on this article? Concerned about the content? Get in touch with us directly. Alternatively, email editorial-team (at) simplywallst.com.
This article by Simply Wall St is general in nature. We provide commentary based on historical data and analyst forecasts only using an unbiased methodology and our articles are not intended to be financial advice. It does not constitute a recommendation to buy or sell any stock, and does not take account of your objectives, or your financial situation. We aim to bring you long-term focused analysis driven by fundamental data. Note that our analysis may not factor in the latest price-sensitive company announcements or qualitative material. Simply Wall St has no position in any stocks mentioned.
Join A Paid User Research Session
You’ll receive a US$30 Amazon Gift card for 1 hour of your time while helping us build better investing tools for the individual investors like yourself. Sign up here
