
 Yahoo Finance
 Frenkel Topping Group (LON:FEN) shareholders have earned a 22% CAGR over the last five years
The worst result, after buying shares in a company (assuming no leverage), would be if you lose all the money you put in. But on the bright side, if you buy shares in a high quality company at the right price, you can gain well over 100%. One great example is Frenkel Topping Group Plc (LON:FEN) which saw its share price drive 138% higher over five years.
So let's assess the underlying fundamentals over the last 5 years and see if they've moved in lock-step with shareholder returns.
View our latest analysis for Frenkel Topping Group
To paraphrase Benjamin Graham: Over the short term the market is a voting machine, but over the long term it's a weighing machine. One imperfect but simple way to consider how the market perception of a company has shifted is to compare the change in the earnings per share (EPS) with the share price movement.
During five years of share price growth, Frenkel Topping Group achieved compound earnings per share (EPS) growth of 5.7% per year. This EPS growth is lower than the 19% average annual increase in the share price. So it's fair to assume the market has a higher opinion of the business than it did five years ago. That's not necessarily surprising considering the five-year track record of earnings growth.
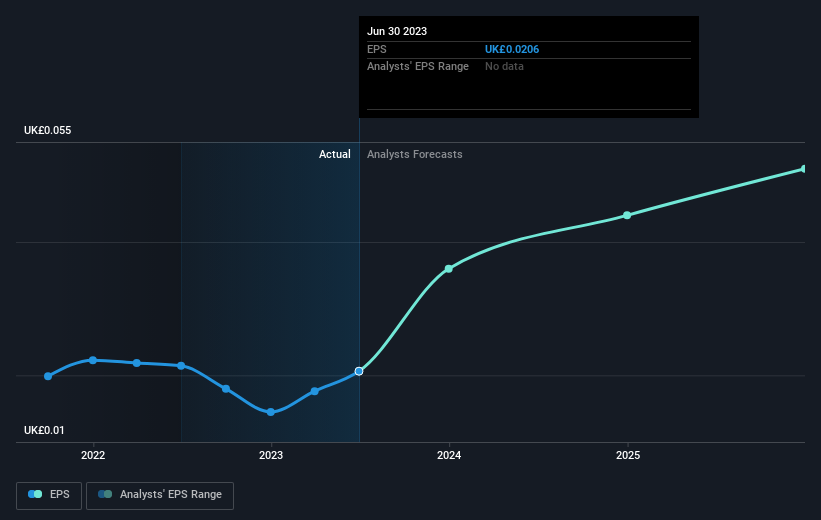
You can see below how EPS has changed over time (discover the exact values by clicking on the image).
We like that insiders have been buying shares in the last twelve months. Having said that, most people consider earnings and revenue growth trends to be a more meaningful guide to the business. This free interactive report on Frenkel Topping Group's earnings, revenue and cash flow is a great place to start, if you want to investigate the stock further.
What About Dividends?
When looking at investment returns, it is important to consider the difference between total shareholder return (TSR) and share price return. Whereas the share price return only reflects the change in the share price, the TSR includes the value of dividends (assuming they were reinvested) and the benefit of any discounted capital raising or spin-off. It's fair to say that the TSR gives a more complete picture for stocks that pay a dividend. As it happens, Frenkel Topping Group's TSR for the last 5 years was 171%, which exceeds the share price return mentioned earlier. This is largely a result of its dividend payments!
A Different Perspective
While the broader market gained around 1.2% in the last year, Frenkel Topping Group shareholders lost 13% (even including dividends). Even the share prices of good stocks drop sometimes, but we want to see improvements in the fundamental metrics of a business, before getting too interested. Longer term investors wouldn't be so upset, since they would have made 22%, each year, over five years. If the fundamental data continues to indicate long term sustainable growth, the current sell-off could be an opportunity worth considering. While it is well worth considering the different impacts that market conditions can have on the share price, there are other factors that are even more important. Even so, be aware that Frenkel Topping Group is showing 1 warning sign in our investment analysis , you should know about...
Frenkel Topping Group is not the only stock insiders are buying. So take a peek at this free list of growing companies with insider buying.
Please note, the market returns quoted in this article reflect the market weighted average returns of stocks that currently trade on British exchanges.
Have feedback on this article? Concerned about the content? Get in touch with us directly. Alternatively, email editorial-team (at) simplywallst.com.
This article by Simply Wall St is general in nature. We provide commentary based on historical data and analyst forecasts only using an unbiased methodology and our articles are not intended to be financial advice. It does not constitute a recommendation to buy or sell any stock, and does not take account of your objectives, or your financial situation. We aim to bring you long-term focused analysis driven by fundamental data. Note that our analysis may not factor in the latest price-sensitive company announcements or qualitative material. Simply Wall St has no position in any stocks mentioned.
