
 Yahoo Finance
 Is Fresenius Medical Care AG & Co. KGaA's (ETR:FME) P/E Ratio Really That Good?

Today, we'll introduce the concept of the P/E ratio for those who are learning about investing. We'll show how you can use Fresenius Medical Care AG & Co. KGaA's (ETR:FME) P/E ratio to inform your assessment of the investment opportunity. What is Fresenius Medical Care KGaA's P/E ratio? Well, based on the last twelve months it is 14.89. That corresponds to an earnings yield of approximately 6.7%.
See our latest analysis for Fresenius Medical Care KGaA
How Do You Calculate Fresenius Medical Care KGaA's P/E Ratio?
The formula for P/E is:
Price to Earnings Ratio = Price per Share ÷ Earnings per Share (EPS)
Or for Fresenius Medical Care KGaA:
P/E of 14.89 = €60.06 ÷ €4.03 (Based on the trailing twelve months to June 2019.)
Is A High Price-to-Earnings Ratio Good?
The higher the P/E ratio, the higher the price tag of a business, relative to its trailing earnings. All else being equal, it's better to pay a low price -- but as Warren Buffett said, 'It's far better to buy a wonderful company at a fair price than a fair company at a wonderful price.
Does Fresenius Medical Care KGaA Have A Relatively High Or Low P/E For Its Industry?
One good way to get a quick read on what market participants expect of a company is to look at its P/E ratio. We can see in the image below that the average P/E (25.7) for companies in the healthcare industry is higher than Fresenius Medical Care KGaA's P/E.
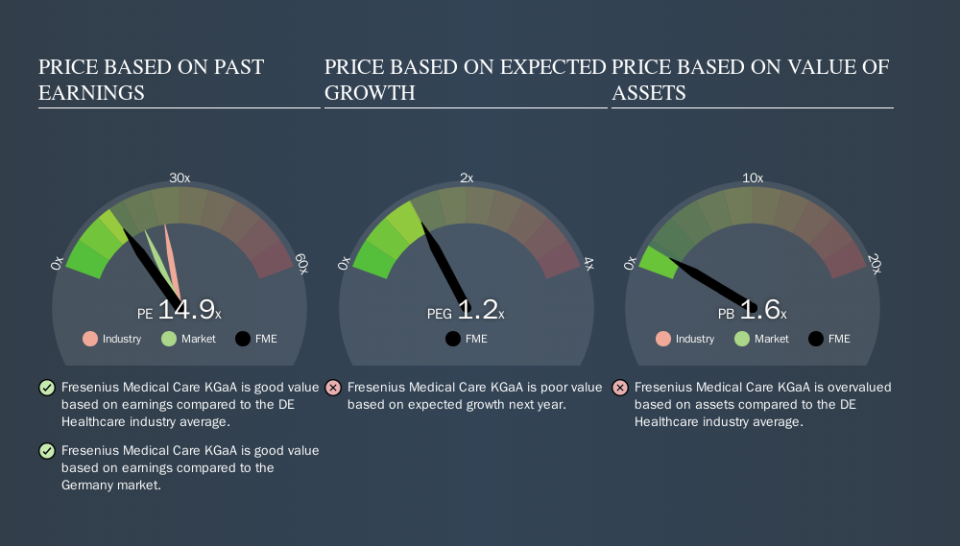
Its relatively low P/E ratio indicates that Fresenius Medical Care KGaA shareholders think it will struggle to do as well as other companies in its industry classification. While current expectations are low, the stock could be undervalued if the situation is better than the market assumes. You should delve deeper. I like to check if company insiders have been buying or selling.
How Growth Rates Impact P/E Ratios
Earnings growth rates have a big influence on P/E ratios. Earnings growth means that in the future the 'E' will be higher. That means unless the share price increases, the P/E will reduce in a few years. And as that P/E ratio drops, the company will look cheap, unless its share price increases.
Fresenius Medical Care KGaA shrunk earnings per share by 37% over the last year. But over the longer term (5 years) earnings per share have increased by 9.4%.
Don't Forget: The P/E Does Not Account For Debt or Bank Deposits
It's important to note that the P/E ratio considers the market capitalization, not the enterprise value. That means it doesn't take debt or cash into account. Theoretically, a business can improve its earnings (and produce a lower P/E in the future) by investing in growth. That means taking on debt (or spending its cash).
While growth expenditure doesn't always pay off, the point is that it is a good option to have; but one that the P/E ratio ignores.
Fresenius Medical Care KGaA's Balance Sheet
Fresenius Medical Care KGaA has net debt equal to 44% of its market cap. You'd want to be aware of this fact, but it doesn't bother us.
The Bottom Line On Fresenius Medical Care KGaA's P/E Ratio
Fresenius Medical Care KGaA trades on a P/E ratio of 14.9, which is below the DE market average of 19.7. The debt levels are not a major concern, but the lack of EPS growth is likely weighing on sentiment.
When the market is wrong about a stock, it gives savvy investors an opportunity. As value investor Benjamin Graham famously said, 'In the short run, the market is a voting machine but in the long run, it is a weighing machine. So this free visualization of the analyst consensus on future earnings could help you make the right decision about whether to buy, sell, or hold.
You might be able to find a better buy than Fresenius Medical Care KGaA. If you want a selection of possible winners, check out this free list of interesting companies that trade on a P/E below 20 (but have proven they can grow earnings).
We aim to bring you long-term focused research analysis driven by fundamental data. Note that our analysis may not factor in the latest price-sensitive company announcements or qualitative material.
If you spot an error that warrants correction, please contact the editor at editorial-team@simplywallst.com. This article by Simply Wall St is general in nature. It does not constitute a recommendation to buy or sell any stock, and does not take account of your objectives, or your financial situation. Simply Wall St has no position in the stocks mentioned. Thank you for reading.
