
 Yahoo Finance
 Fresenius Medical Care KGaA (ETR:FME) Will Be Hoping To Turn Its Returns On Capital Around
Did you know there are some financial metrics that can provide clues of a potential multi-bagger? Firstly, we'll want to see a proven return on capital employed (ROCE) that is increasing, and secondly, an expanding base of capital employed. This shows us that it's a compounding machine, able to continually reinvest its earnings back into the business and generate higher returns. Having said that, from a first glance at Fresenius Medical Care KGaA (ETR:FME) we aren't jumping out of our chairs at how returns are trending, but let's have a deeper look.
What Is Return On Capital Employed (ROCE)?
If you haven't worked with ROCE before, it measures the 'return' (pre-tax profit) a company generates from capital employed in its business. Analysts use this formula to calculate it for Fresenius Medical Care KGaA:
Return on Capital Employed = Earnings Before Interest and Tax (EBIT) ÷ (Total Assets - Current Liabilities)
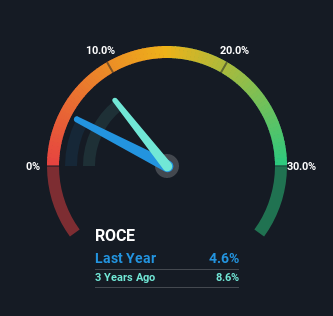
0.046 = €1.5b ÷ (€38b - €6.4b) (Based on the trailing twelve months to September 2022).
So, Fresenius Medical Care KGaA has an ROCE of 4.6%. On its own, that's a low figure but it's around the 5.6% average generated by the Healthcare industry.
See our latest analysis for Fresenius Medical Care KGaA
In the above chart we have measured Fresenius Medical Care KGaA's prior ROCE against its prior performance, but the future is arguably more important. If you're interested, you can view the analysts predictions in our free report on analyst forecasts for the company.
How Are Returns Trending?
In terms of Fresenius Medical Care KGaA's historical ROCE movements, the trend isn't fantastic. To be more specific, ROCE has fallen from 13% over the last five years. However it looks like Fresenius Medical Care KGaA might be reinvesting for long term growth because while capital employed has increased, the company's sales haven't changed much in the last 12 months. It may take some time before the company starts to see any change in earnings from these investments.
Our Take On Fresenius Medical Care KGaA's ROCE
In summary, Fresenius Medical Care KGaA is reinvesting funds back into the business for growth but unfortunately it looks like sales haven't increased much just yet. And in the last five years, the stock has given away 63% so the market doesn't look too hopeful on these trends strengthening any time soon. All in all, the inherent trends aren't typical of multi-baggers, so if that's what you're after, we think you might have more luck elsewhere.
One more thing, we've spotted 2 warning signs facing Fresenius Medical Care KGaA that you might find interesting.
For those who like to invest in solid companies, check out this free list of companies with solid balance sheets and high returns on equity.
Have feedback on this article? Concerned about the content? Get in touch with us directly. Alternatively, email editorial-team (at) simplywallst.com.
This article by Simply Wall St is general in nature. We provide commentary based on historical data and analyst forecasts only using an unbiased methodology and our articles are not intended to be financial advice. It does not constitute a recommendation to buy or sell any stock, and does not take account of your objectives, or your financial situation. We aim to bring you long-term focused analysis driven by fundamental data. Note that our analysis may not factor in the latest price-sensitive company announcements or qualitative material. Simply Wall St has no position in any stocks mentioned.
Join A Paid User Research Session
You’ll receive a US$30 Amazon Gift card for 1 hour of your time while helping us build better investing tools for the individual investors like yourself. Sign up here
