
 Yahoo Finance
 Is Fresenius SE & Co. KGaA (ETR:FRE) An Attractive Dividend Stock?

Today we'll take a closer look at Fresenius SE & Co. KGaA (ETR:FRE) from a dividend investor's perspective. Owning a strong business and reinvesting the dividends is widely seen as an attractive way of growing your wealth. If you are hoping to live on your dividends, it's important to be more stringent with your investments than the average punter. Regular readers know we like to apply the same approach to each dividend stock, and we hope you'll find our analysis useful.
A slim 1.9% yield is hard to get excited about, but the long payment history is respectable. At the right price, or with strong growth opportunities, Fresenius SE KGaA could have potential. Before you buy any stock for its dividend however, you should always remember Warren Buffett's two rules: 1) Don't lose money, and 2) Remember rule #1. We'll run through some checks below to help with this.
Explore this interactive chart for our latest analysis on Fresenius SE KGaA!
Payout ratios
Companies (usually) pay dividends out of their earnings. If a company is paying more than it earns, the dividend might have to be cut. Comparing dividend payments to a company's net profit after tax is a simple way of reality-checking whether a dividend is sustainable. Fresenius SE KGaA paid out 24% of its profit as dividends, over the trailing twelve month period. With a low payout ratio, it looks like the dividend is comprehensively covered by earnings.
In addition to comparing dividends against profits, we should inspect whether the company generated enough cash to pay its dividend. Of the free cash flow it generated last year, Fresenius SE KGaA paid out 28% as dividends, suggesting the dividend is affordable. It's encouraging to see that the dividend is covered by both profit and cash flow. This generally suggests the dividend is sustainable, as long as earnings don't drop precipitously.
Is Fresenius SE KGaA's Balance Sheet Risky?
As Fresenius SE KGaA has a meaningful amount of debt, we need to check its balance sheet to see if the company might have debt risks. A quick check of its financial situation can be done with two ratios: net debt divided by EBITDA (earnings before interest, tax, depreciation and amortisation), and net interest cover. Net debt to EBITDA measures total debt load relative to company earnings (lower = less debt), while net interest cover measures the ability to pay interest on the debt (higher = greater ability to pay interest costs). Fresenius SE KGaA is carrying net debt of 3.34 times its EBITDA, which is getting towards the upper limit of our comfort range on a dividend stock that the investor hopes will endure a wide range of economic circumstances.
We calculated its interest cover by measuring its earnings before interest and tax (EBIT), and dividing this by the company's net interest expense. Fresenius SE KGaA has EBIT of 6.79 times its interest expense, which we think is adequate.
Remember, you can always get a snapshot of Fresenius SE KGaA's latest financial position, by checking our visualisation of its financial health.
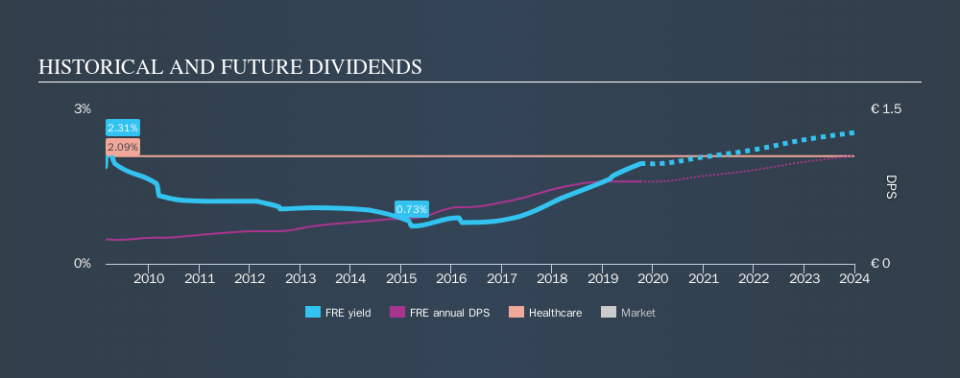
Dividend Volatility
From the perspective of an income investor who wants to earn dividends for many years, there is not much point buying a stock if its dividend is regularly cut or is not reliable. Fresenius SE KGaA has been paying dividends for a long time, but for the purpose of this analysis, we only examine the past 10 years of payments. During this period the dividend has been stable, which could imply the business could have relatively consistent earnings power. During the past ten-year period, the first annual payment was €0.24 in 2009, compared to €0.80 last year. Dividends per share have grown at approximately 13% per year over this time.
Dividends have been growing pretty quickly, and even more impressively, they haven't experienced any notable falls during this period.
Dividend Growth Potential
While dividend payments have been relatively reliable, it would also be nice if earnings per share (EPS) were growing, as this is essential to maintaining the dividend's purchasing power over the long term. It's good to see Fresenius SE KGaA has been growing its earnings per share at 12% a year over the past five years. Earnings per share are growing at a solid clip, and the payout ratio is low. We think this is an ideal combination in a dividend stock.
Conclusion
Dividend investors should always want to know if a) a company's dividends are affordable, b) if there is a track record of consistent payments, and c) if the dividend is capable of growing. It's great to see that Fresenius SE KGaA is paying out a low percentage of its earnings and cash flow. That said, we were glad to see it growing earnings and paying a fairly consistent dividend. All these things considered, we think this organisation has a lot going for it from a dividend perspective.
Companies that are growing earnings tend to be the best dividend stocks over the long term. See what the 21 analysts we track are forecasting for Fresenius SE KGaA for free with public analyst estimates for the company.
Looking for more high-yielding dividend ideas? Try our curated list of dividend stocks with a yield above 3%.
We aim to bring you long-term focused research analysis driven by fundamental data. Note that our analysis may not factor in the latest price-sensitive company announcements or qualitative material.
If you spot an error that warrants correction, please contact the editor at editorial-team@simplywallst.com. This article by Simply Wall St is general in nature. It does not constitute a recommendation to buy or sell any stock, and does not take account of your objectives, or your financial situation. Simply Wall St has no position in the stocks mentioned. Thank you for reading.
