
 Yahoo Finance
 Which FTSE Tracker Should I Choose?

UK investors have had a rough ride this year as Brexit, coronavirus, and dividend cuts have kept domestic stocks out of favour. Fears of a second wave and new regional restrictions on UK life have led to further weakness in share prices this autumn. Sectors such as retail, leisure and hospitality have been particularly hard hit.
The FTSE 100, 250 and AllShare indices are down 22%, 19% and 21% respectively this year, whereas many global indices such as the S&P 500 and Nasdaq are higher than at the start of the year despite the March crash and the global pandemic.
These indices matter because many UK investors are buying tracker funds in this year’s turmoil – the Vanguard FTSE All Share boasts the biggest inflows this year among funds with a Morningstar Analyst Rating of Gold, for example. Trackers are a cheap way of buying into stock market growth and active managers also benchmark their performance against them, especially against the FTSE AllShare. UK investors, like most people, are also prone to home bias, which means a tendency to buy companies and indices that they are familiar with.
We look in detail at the advantages and disadvantages of each index and using Morningstar data going back 20 years, reveal the vast difference in long-term performance when dividends are stripped out.
FTSE 100 Underperforms
Pros
Exposure to the UK’s biggest companies
Global focus
Cons
Affected by currency fluctuations
High sector concentration: eg. banks and oil companies

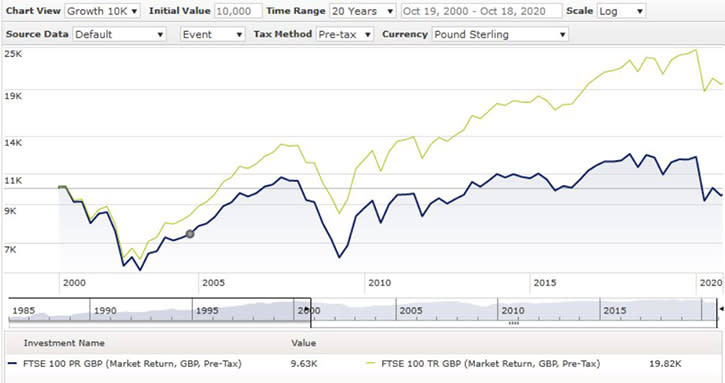
In bare index number terms, the FTSE 100, at 5,886 points, is below the level it was at 20 years ago, when it was just above 6,200 points. That’s even excluding the costs of holding the index in a tracker and paying fund and platform fees. Looking at the above chart, a £10,000 investment would be worth £9,560 after 20 years, but that sum would be worth nearly £20,000 including dividends – so an investor would have doubled their money, a reasonable if not spectacular result given the gains available in other parts of the world in that time period.
FTSE 250 Investors Well Rewarded
Pros
More UK-focused
Exposure to higher growth companies
Cons
Lower yield than FTSE 100 and AllShare
UK equities now out of favour
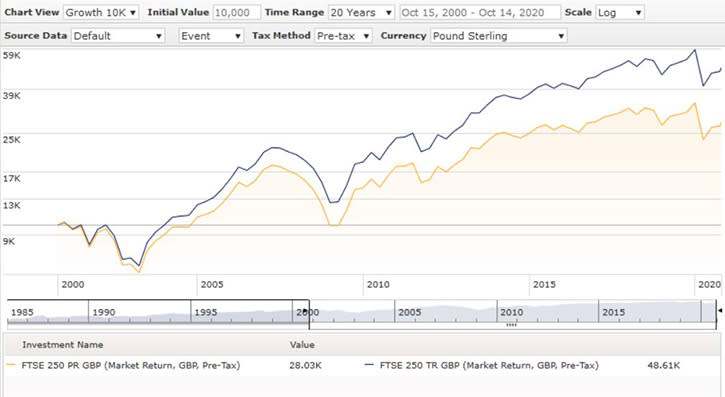
The mid-cap focused FTSE 250 has fared much better than the FTSE 100 or AllShare over 20 years, rising from 6,404 in 2000 to 17,868 today, a gain of 179% (for comparison, the Dow Jones is up by a similar amount in percentage terms over the period).
Taking our investor's notional £10,000 invested in 2000, that would have turned into an impressive £28,000 on the capital gains alone and nearly £50,000 including dividends (effectively a five-fold return in 20 years).
FTSE AllShare Disappoints
Pros
Broadest coverage with 613 stocks
Yields 4.5%
Cons
Poor long-term performance
Is 600+ stocks too many?
The AllShare is only 300 points higher than in October 2000 and the £10,000 invested in 2000 would have become a paltry £11,000 without dividends, and £22,000 with - so like the FTSE 100, on a total return basis, you would have doubled your money.
Fees and Inflation
It’s worth bearing in mind that the after-fees return of a tracker fund is likely to be lower than the index itself. However, costs have come down considerably in recent years and the increased Isa allowance (currently £20,000) means investors can enjoy tax-free returns.
But inflation is also a key consideration for investors; according to the Bank of England, from 2000 to 2019 inflation averaged 2.8% a year, meaning £10,000 in 2000 is effectively worth nearly £17,000 now. This means that if you could have found a saving account that kept up with inflation in that period, you would have been better off keeping your money in cash than buying a FTSE 100 or AllShare tracker - the stock market investor would also have had to endure the rollercoaster ride that was the global financial crisis and coronavirus pandemic in that period.
With dividends taken into account, however, the picture is more promising. Still, the current UK dividend drought makes it hard to project such generous payouts continuing over the next 20 years. Brexit complications are also a reason to be cautious towards UK shares, as well as the astonishing success of US tech firms in recent years, which has tempted investors to look overseas for returns. Of the Morningstar-rated funds, Vanguard FTSE UK AllShare and the L&G UK Index have Gold Analyst Ratings.
