
 Yahoo Finance
 How Do Fuller, Smith & Turner P.L.C.’s (LON:FSTA) Returns Compare To Its Industry?

Today we are going to look at Fuller, Smith & Turner P.L.C. (LON:FSTA) to see whether it might be an attractive investment prospect. In particular, we'll consider its Return On Capital Employed (ROCE), as that can give us insight into how profitably the company is able to employ capital in its business.
First, we'll go over how we calculate ROCE. Then we'll compare its ROCE to similar companies. Then we'll determine how its current liabilities are affecting its ROCE.
Return On Capital Employed (ROCE): What is it?
ROCE is a measure of a company's yearly pre-tax profit (its return), relative to the capital employed in the business. Generally speaking a higher ROCE is better. Overall, it is a valuable metric that has its flaws. Author Edwin Whiting says to be careful when comparing the ROCE of different businesses, since 'No two businesses are exactly alike.
So, How Do We Calculate ROCE?
The formula for calculating the return on capital employed is:
Return on Capital Employed = Earnings Before Interest and Tax (EBIT) ÷ (Total Assets - Current Liabilities)
Or for Fuller Smith & Turner:
0.042 = UK£30m ÷ (UK£755m - UK£46m) (Based on the trailing twelve months to September 2019.)
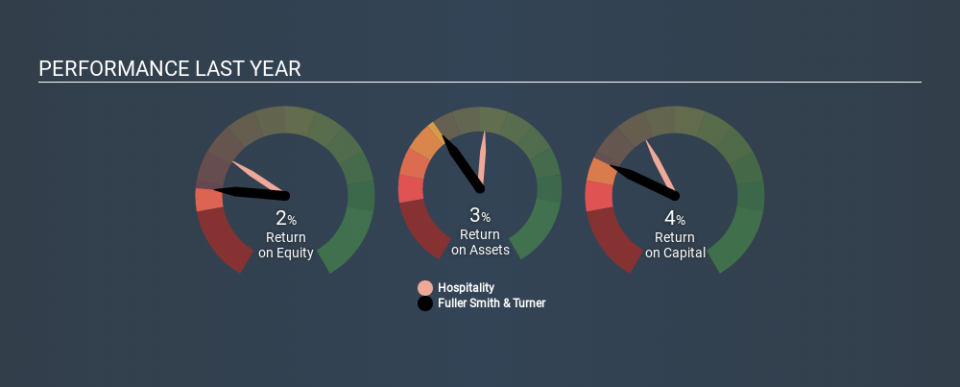
So, Fuller Smith & Turner has an ROCE of 4.2%.
View our latest analysis for Fuller Smith & Turner
Is Fuller Smith & Turner's ROCE Good?
When making comparisons between similar businesses, investors may find ROCE useful. In this analysis, Fuller Smith & Turner's ROCE appears meaningfully below the 7.6% average reported by the Hospitality industry. This could be seen as a negative, as it suggests some competitors may be employing their capital more efficiently. Separate from how Fuller Smith & Turner stacks up against its industry, its ROCE in absolute terms is mediocre; relative to the returns on government bonds. Investors may wish to consider higher-performing investments.
Fuller Smith & Turner's current ROCE of 4.2% is lower than 3 years ago, when the company reported a 8.7% ROCE. So investors might consider if it has had issues recently. You can click on the image below to see (in greater detail) how Fuller Smith & Turner's past growth compares to other companies.
When considering ROCE, bear in mind that it reflects the past and does not necessarily predict the future. ROCE can be deceptive for cyclical businesses, as returns can look incredible in boom times, and terribly low in downturns. This is because ROCE only looks at one year, instead of considering returns across a whole cycle. Future performance is what matters, and you can see analyst predictions in our free report on analyst forecasts for the company.
Do Fuller Smith & Turner's Current Liabilities Skew Its ROCE?
Current liabilities include invoices, such as supplier payments, short-term debt, or a tax bill, that need to be paid within 12 months. Due to the way ROCE is calculated, a high level of current liabilities makes a company look as though it has less capital employed, and thus can (sometimes unfairly) boost the ROCE. To counter this, investors can check if a company has high current liabilities relative to total assets.
Fuller Smith & Turner has total liabilities of UK£46m and total assets of UK£755m. Therefore its current liabilities are equivalent to approximately 6.1% of its total assets. Fuller Smith & Turner has a low level of current liabilities, which have a minimal impact on its uninspiring ROCE.
The Bottom Line On Fuller Smith & Turner's ROCE
If performance improves, then Fuller Smith & Turner may be an OK investment, especially at the right valuation. You might be able to find a better investment than Fuller Smith & Turner. If you want a selection of possible winners, check out this free list of interesting companies that trade on a P/E below 20 (but have proven they can grow earnings).
If you like to buy stocks alongside management, then you might just love this free list of companies. (Hint: insiders have been buying them).
If you spot an error that warrants correction, please contact the editor at editorial-team@simplywallst.com. This article by Simply Wall St is general in nature. It does not constitute a recommendation to buy or sell any stock, and does not take account of your objectives, or your financial situation. Simply Wall St has no position in the stocks mentioned.
We aim to bring you long-term focused research analysis driven by fundamental data. Note that our analysis may not factor in the latest price-sensitive company announcements or qualitative material. Thank you for reading.
