
 Yahoo Finance
 Further weakness as JD.com (NASDAQ:JD) drops 8.9% this week, taking one-year losses to 33%
Passive investing in an index fund is a good way to ensure your own returns roughly match the overall market. When you buy individual stocks, you can make higher profits, but you also face the risk of under-performance. Unfortunately the JD.com, Inc. (NASDAQ:JD) share price slid 35% over twelve months. That contrasts poorly with the market decline of 4.1%. Longer term shareholders haven't suffered as badly, since the stock is down a comparatively less painful 24% in three years. It's down 44% in about a quarter. This could be related to the recent financial results - you can catch up on the most recent data by reading our company report.
After losing 8.9% this past week, it's worth investigating the company's fundamentals to see what we can infer from past performance.
View our latest analysis for JD.com
While the efficient markets hypothesis continues to be taught by some, it has been proven that markets are over-reactive dynamic systems, and investors are not always rational. One imperfect but simple way to consider how the market perception of a company has shifted is to compare the change in the earnings per share (EPS) with the share price movement.
JD.com managed to increase earnings per share from a loss to a profit, over the last 12 months.
Earnings per share growth rates aren't particularly useful for comparing with the share price, when a company has moved from loss to profit. But we may find different metrics more enlightening.
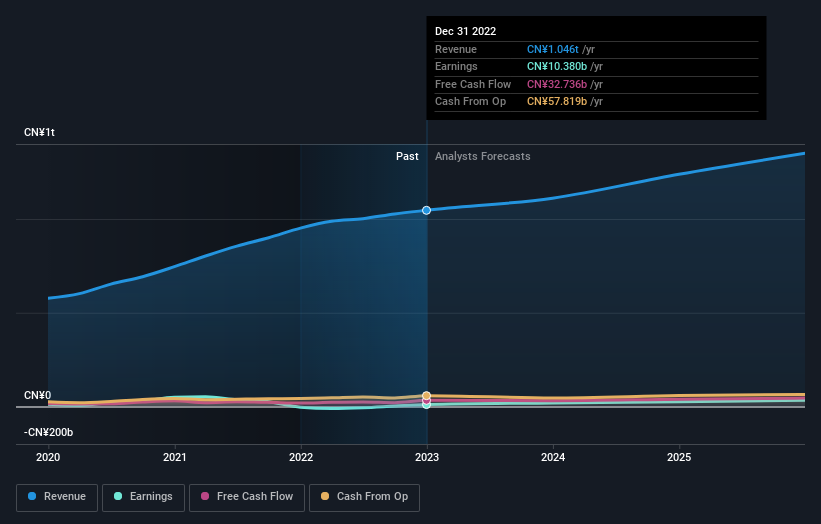
With a low yield of 1.8% we doubt that the dividend influences the share price much. JD.com's revenue is actually up 9.9% over the last year. Since the fundamental metrics don't readily explain the share price drop, there might be an opportunity if the market has overreacted.
The graphic below depicts how earnings and revenue have changed over time (unveil the exact values by clicking on the image).
JD.com is a well known stock, with plenty of analyst coverage, suggesting some visibility into future growth. So it makes a lot of sense to check out what analysts think JD.com will earn in the future (free analyst consensus estimates)
What About Dividends?
It is important to consider the total shareholder return, as well as the share price return, for any given stock. Whereas the share price return only reflects the change in the share price, the TSR includes the value of dividends (assuming they were reinvested) and the benefit of any discounted capital raising or spin-off. It's fair to say that the TSR gives a more complete picture for stocks that pay a dividend. In the case of JD.com, it has a TSR of -33% for the last 1 year. That exceeds its share price return that we previously mentioned. This is largely a result of its dividend payments!
A Different Perspective
While the broader market lost about 4.1% in the twelve months, JD.com shareholders did even worse, losing 33% (even including dividends). However, it could simply be that the share price has been impacted by broader market jitters. It might be worth keeping an eye on the fundamentals, in case there's a good opportunity. Unfortunately, last year's performance may indicate unresolved challenges, given that it was worse than the annualised loss of 0.2% over the last half decade. We realise that Baron Rothschild has said investors should "buy when there is blood on the streets", but we caution that investors should first be sure they are buying a high quality business. It's always interesting to track share price performance over the longer term. But to understand JD.com better, we need to consider many other factors. For example, we've discovered 3 warning signs for JD.com that you should be aware of before investing here.
Of course JD.com may not be the best stock to buy. So you may wish to see this free collection of growth stocks.
Please note, the market returns quoted in this article reflect the market weighted average returns of stocks that currently trade on American exchanges.
Have feedback on this article? Concerned about the content? Get in touch with us directly. Alternatively, email editorial-team (at) simplywallst.com.
This article by Simply Wall St is general in nature. We provide commentary based on historical data and analyst forecasts only using an unbiased methodology and our articles are not intended to be financial advice. It does not constitute a recommendation to buy or sell any stock, and does not take account of your objectives, or your financial situation. We aim to bring you long-term focused analysis driven by fundamental data. Note that our analysis may not factor in the latest price-sensitive company announcements or qualitative material. Simply Wall St has no position in any stocks mentioned.
Join A Paid User Research Session
You’ll receive a US$30 Amazon Gift card for 1 hour of your time while helping us build better investing tools for the individual investors like yourself. Sign up here
