
 Yahoo Finance
 Do FW Thorpe Plc’s (LON:TFW) Returns On Capital Employed Make The Cut?

Today we'll evaluate FW Thorpe Plc (LON:TFW) to determine whether it could have potential as an investment idea. To be precise, we'll consider its Return On Capital Employed (ROCE), as that will inform our view of the quality of the business.
Firstly, we'll go over how we calculate ROCE. Next, we'll compare it to others in its industry. Then we'll determine how its current liabilities are affecting its ROCE.
Understanding Return On Capital Employed (ROCE)
ROCE is a metric for evaluating how much pre-tax income (in percentage terms) a company earns on the capital invested in its business. All else being equal, a better business will have a higher ROCE. Ultimately, it is a useful but imperfect metric. Renowned investment researcher Michael Mauboussin has suggested that a high ROCE can indicate that 'one dollar invested in the company generates value of more than one dollar'.
So, How Do We Calculate ROCE?
The formula for calculating the return on capital employed is:
Return on Capital Employed = Earnings Before Interest and Tax (EBIT) ÷ (Total Assets - Current Liabilities)
Or for FW Thorpe:
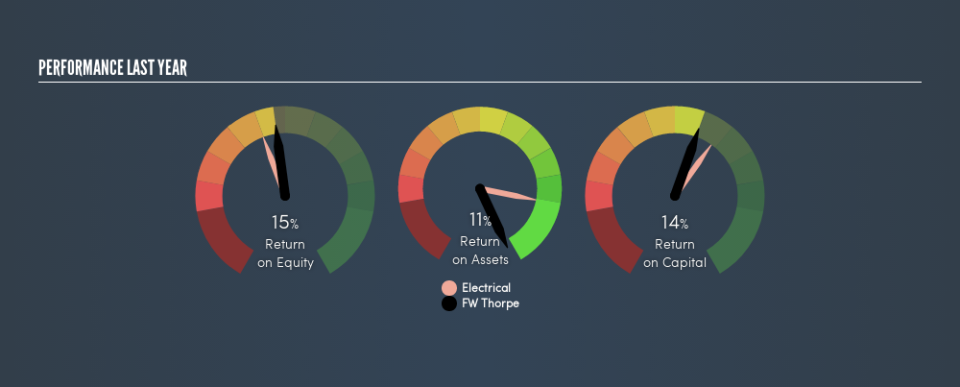
0.14 = UK£18m ÷ (UK£151m - UK£22m) (Based on the trailing twelve months to December 2018.)
So, FW Thorpe has an ROCE of 14%.
Want to participate in a short research study? Help shape the future of investing tools and you could win a $250 gift card!
View our latest analysis for FW Thorpe
Does FW Thorpe Have A Good ROCE?
One way to assess ROCE is to compare similar companies. It appears that FW Thorpe's ROCE is fairly close to the Electrical industry average of 14%. Regardless of where FW Thorpe sits next to its industry, its ROCE in absolute terms appears satisfactory, and this company could be worth a closer look.
When considering this metric, keep in mind that it is backwards looking, and not necessarily predictive. Companies in cyclical industries can be difficult to understand using ROCE, as returns typically look high during boom times, and low during busts. ROCE is only a point-in-time measure. Future performance is what matters, and you can see analyst predictions in our free report on analyst forecasts for the company.
What Are Current Liabilities, And How Do They Affect FW Thorpe's ROCE?
Short term (or current) liabilities, are things like supplier invoices, overdrafts, or tax bills that need to be paid within 12 months. Due to the way ROCE is calculated, a high level of current liabilities makes a company look as though it has less capital employed, and thus can (sometimes unfairly) boost the ROCE. To check the impact of this, we calculate if a company has high current liabilities relative to its total assets.
FW Thorpe has total liabilities of UK£22m and total assets of UK£151m. Therefore its current liabilities are equivalent to approximately 15% of its total assets. Current liabilities are minimal, limiting the impact on ROCE.
What We Can Learn From FW Thorpe's ROCE
This is good to see, and with a sound ROCE, FW Thorpe could be worth a closer look. There might be better investments than FW Thorpe out there, but you will have to work hard to find them . These promising businesses with rapidly growing earnings might be right up your alley.
If you are like me, then you will not want to miss this free list of growing companies that insiders are buying.
We aim to bring you long-term focused research analysis driven by fundamental data. Note that our analysis may not factor in the latest price-sensitive company announcements or qualitative material.
If you spot an error that warrants correction, please contact the editor at editorial-team@simplywallst.com. This article by Simply Wall St is general in nature. It does not constitute a recommendation to buy or sell any stock, and does not take account of your objectives, or your financial situation. Simply Wall St has no position in the stocks mentioned. Thank you for reading.
