
 Yahoo Finance
 Is FW Thorpe Plc's (LON:TFW) Recent Stock Performance Influenced By Its Financials In Any Way?
Most readers would already know that FW Thorpe's (LON:TFW) stock increased by 2.1% over the past week. Given that stock prices are usually aligned with a company's financial performance in the long-term, we decided to investigate if the company's decent financials had a hand to play in the recent price move. Specifically, we decided to study FW Thorpe's ROE in this article.
Return on Equity or ROE is a test of how effectively a company is growing its value and managing investors’ money. In short, ROE shows the profit each dollar generates with respect to its shareholder investments.
Check out our latest analysis for FW Thorpe
How Do You Calculate Return On Equity?
ROE can be calculated by using the formula:
Return on Equity = Net Profit (from continuing operations) ÷ Shareholders' Equity
So, based on the above formula, the ROE for FW Thorpe is:
10% = UK£13m ÷ UK£130m (Based on the trailing twelve months to December 2020).
The 'return' is the yearly profit. So, this means that for every £1 of its shareholder's investments, the company generates a profit of £0.10.
What Is The Relationship Between ROE And Earnings Growth?
Thus far, we have learned that ROE measures how efficiently a company is generating its profits. Depending on how much of these profits the company reinvests or "retains", and how effectively it does so, we are then able to assess a company’s earnings growth potential. Generally speaking, other things being equal, firms with a high return on equity and profit retention, have a higher growth rate than firms that don’t share these attributes.
A Side By Side comparison of FW Thorpe's Earnings Growth And 10% ROE
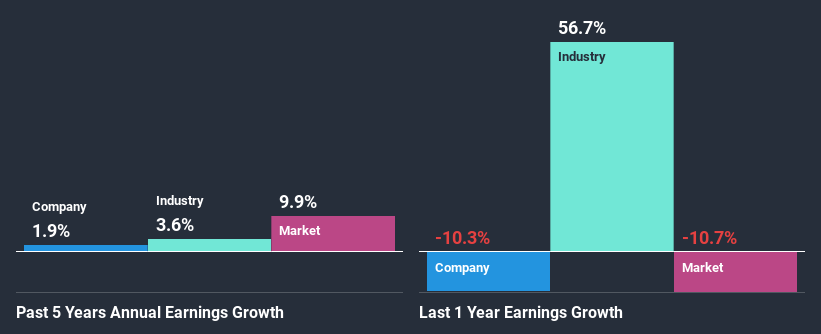
To start with, FW Thorpe's ROE looks acceptable. Further, the company's ROE is similar to the industry average of 11%. Despite this, FW Thorpe's five year net income growth was quite flat over the past five years. So, there could be some other aspects that could potentially be preventing the company from growing. These include low earnings retention or poor allocation of capital.
As a next step, we compared FW Thorpe's net income growth with the industry and were disappointed to see that the company's growth is lower than the industry average growth of 3.6% in the same period.
The basis for attaching value to a company is, to a great extent, tied to its earnings growth. It’s important for an investor to know whether the market has priced in the company's expected earnings growth (or decline). By doing so, they will have an idea if the stock is headed into clear blue waters or if swampy waters await. If you're wondering about FW Thorpe's's valuation, check out this gauge of its price-to-earnings ratio, as compared to its industry.
Is FW Thorpe Efficiently Re-investing Its Profits?
Despite having a moderate three-year median payout ratio of 40% (meaning the company retains60% of profits) in the last three-year period, FW Thorpe's earnings growth was more or les flat. Therefore, there might be some other reasons to explain the lack in that respect. For example, the business could be in decline.
In addition, FW Thorpe has been paying dividends over a period of at least ten years suggesting that keeping up dividend payments is way more important to the management even if it comes at the cost of business growth.
Conclusion
Overall, we feel that FW Thorpe certainly does have some positive factors to consider. Yet, the low earnings growth is a bit concerning, especially given that the company has a high rate of return and is reinvesting ma huge portion of its profits. By the looks of it, there could be some other factors, not necessarily in control of the business, that's preventing growth. Until now, we have only just grazed the surface of the company's past performance by looking at the company's fundamentals. You can do your own research on FW Thorpe and see how it has performed in the past by looking at this FREE detailed graph of past earnings, revenue and cash flows.
This article by Simply Wall St is general in nature. It does not constitute a recommendation to buy or sell any stock, and does not take account of your objectives, or your financial situation. We aim to bring you long-term focused analysis driven by fundamental data. Note that our analysis may not factor in the latest price-sensitive company announcements or qualitative material. Simply Wall St has no position in any stocks mentioned.
Have feedback on this article? Concerned about the content? Get in touch with us directly. Alternatively, email editorial-team (at) simplywallst.com.
