
 Yahoo Finance
 The A.G. BARR (LON:BAG) Share Price Is Down 33% So Some Shareholders Are Getting Worried

Passive investing in an index fund is a good way to ensure your own returns roughly match the overall market. While individual stocks can be big winners, plenty more fail to generate satisfactory returns. For example, the A.G. BARR p.l.c. (LON:BAG) share price is down 33% in the last year. That contrasts poorly with the market return of 18%. On the other hand, the stock is actually up 4.9% over three years. The last week also saw the share price slip down another 5.8%.
View our latest analysis for A.G. BARR
While the efficient markets hypothesis continues to be taught by some, it has been proven that markets are over-reactive dynamic systems, and investors are not always rational. One flawed but reasonable way to assess how sentiment around a company has changed is to compare the earnings per share (EPS) with the share price.
Unfortunately A.G. BARR reported an EPS drop of 10% for the last year. This reduction in EPS is not as bad as the 33% share price fall. This suggests the EPS fall has made some shareholders are more nervous about the business.
The image below shows how EPS has tracked over time (if you click on the image you can see greater detail).
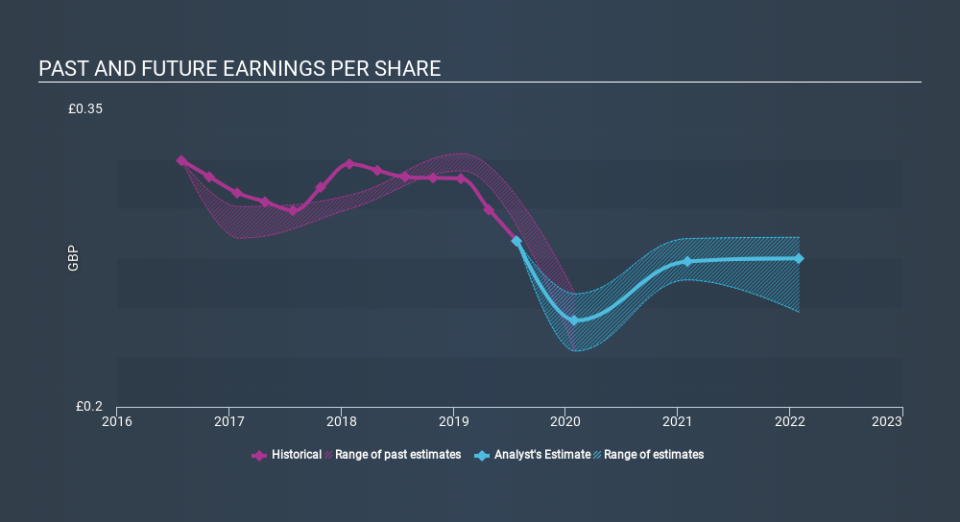
Before buying or selling a stock, we always recommend a close examination of historic growth trends, available here.
What about the Total Shareholder Return (TSR)?
Investors should note that there's a difference between A.G. BARR's total shareholder return (TSR) and its share price change, which we've covered above. The TSR attempts to capture the value of dividends (as if they were reinvested) as well as any spin-offs or discounted capital raisings offered to shareholders. Dividends have been really beneficial for A.G. BARR shareholders, and that cash payout explains why its total shareholder loss of 32%, over the last year, isn't as bad as the share price return.
A Different Perspective
Investors in A.G. BARR had a tough year, with a total loss of 32% (including dividends) , against a market gain of about 18%. However, keep in mind that even the best stocks will sometimes underperform the market over a twelve month period. On the bright side, long term shareholders have made money, with a gain of 0.2% per year over half a decade. If the fundamental data continues to indicate long term sustainable growth, the current sell-off could be an opportunity worth considering. Most investors take the time to check the data on insider transactions. You can click here to see if insiders have been buying or selling.
If you like to buy stocks alongside management, then you might just love this free list of companies. (Hint: insiders have been buying them).
Please note, the market returns quoted in this article reflect the market weighted average returns of stocks that currently trade on GB exchanges.
If you spot an error that warrants correction, please contact the editor at editorial-team@simplywallst.com. This article by Simply Wall St is general in nature. It does not constitute a recommendation to buy or sell any stock, and does not take account of your objectives, or your financial situation. Simply Wall St has no position in the stocks mentioned.
We aim to bring you long-term focused research analysis driven by fundamental data. Note that our analysis may not factor in the latest price-sensitive company announcements or qualitative material. Thank you for reading.
