
 Yahoo Finance
 Is G4S plc's (LON:GFS) 4.4% Dividend Worth Your Time?

Dividend paying stocks like G4S plc (LON:GFS) tend to be popular with investors, and for good reason - some research suggests a significant amount of all stock market returns come from reinvested dividends. Unfortunately, it's common for investors to be enticed in by the seemingly attractive yield, and lose money when the company has to cut its dividend payments.
A high yield and a long history of paying dividends is an appealing combination for G4S. It would not be a surprise to discover that many investors buy it for the dividends. Some simple analysis can reduce the risk of holding G4S for its dividend, and we'll focus on the most important aspects below.
Click the interactive chart for our full dividend analysis
Payout ratios
Dividends are usually paid out of company earnings. If a company is paying more than it earns, then the dividend might become unsustainable - hardly an ideal situation. Comparing dividend payments to a company's net profit after tax is a simple way of reality-checking whether a dividend is sustainable. In the last year, G4S paid out 395% of its profit as dividends. Unless there are extenuating circumstances, from the perspective of an investor who hopes to own the company for many years, a payout ratio of above 100% is definitely a concern.
In addition to comparing dividends against profits, we should inspect whether the company generated enough cash to pay its dividend. G4S paid out 112% of its free cash last year. Cash flows can be lumpy, but this dividend was not well covered by cash flow. Cash is slightly more important than profit from a dividend perspective, but given G4S's payments were not well covered by either earnings or cash flow, we are concerned about the sustainability of this dividend.
Is G4S's Balance Sheet Risky?
As G4S's dividend was not well covered by earnings, we need to check its balance sheet for signs of financial distress. A rough way to check this is with these two simple ratios: a) net debt divided by EBITDA (earnings before interest, tax, depreciation and amortisation), and b) net interest cover. Net debt to EBITDA is a measure of a company's total debt. Net interest cover measures the ability to meet interest payments. Essentially we check that a) the company does not have too much debt, and b) that it can afford to pay the interest. G4S has net debt of 3.33 times its EBITDA, which is getting towards the limit of most investors' comfort zones. Judicious use of debt can enhance shareholder returns, but also adds to the risk if something goes awry.
We calculated its interest cover by measuring its earnings before interest and tax (EBIT), and dividing this by the company's net interest expense. Interest cover of 4.58 times its interest expense is starting to become a concern for G4S, and be aware that lenders may place additional restrictions on the company as well.
We update our data on G4S every 24 hours, so you can always get our latest analysis of its financial health, here.
Dividend Volatility
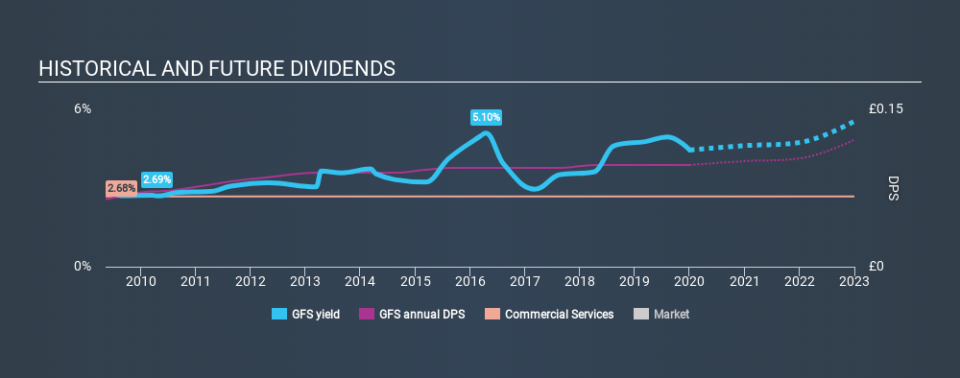
One of the major risks of relying on dividend income, is the potential for a company to struggle financially and cut its dividend. Not only is your income cut, but the value of your investment declines as well - nasty. For the purpose of this article, we only scrutinise the last decade of G4S's dividend payments. The dividend has been stable over the past 10 years, which is great. We think this could suggest some resilience to the business and its dividends. During the past ten-year period, the first annual payment was UK£0.064 in 2010, compared to UK£0.097 last year. This works out to be a compound annual growth rate (CAGR) of approximately 4.2% a year over that time.
While the consistency in the dividend payments is impressive, we think the relatively slow rate of growth is unappealing.
Dividend Growth Potential
Dividend payments have been consistent over the past few years, but we should always check if earnings per share (EPS) are growing, as this will help maintain the purchasing power of the dividend. It's good to see G4S has been growing its earnings per share at 30% a year over the past five years. The company has been growing its EPS at a very rapid rate, while paying out virtually all of its income as dividends. Generally, a company that is growing rapidly while paying out a majority of its earnings, is seeing its debt burden increase. We'd be conscious of any extra risk added by this practice.
Conclusion
When we look at a dividend stock, we need to form a judgement on whether the dividend will grow, if the company is able to maintain it in a wide range of economic circumstances, and if the dividend payout is sustainable. G4S paid out almost all of its cash flow and profit as dividends, leaving little to reinvest in the business. Next, growing earnings per share and steady dividend payments is a great combination. Ultimately, G4S comes up short on our dividend analysis. It's not that we think it is a bad company - just that there are likely more appealing dividend prospects out there on this analysis.
Earnings growth generally bodes well for the future value of company dividend payments. See if the 12 G4S analysts we track are forecasting continued growth with our free report on analyst estimates for the company.
We have also put together a list of global stocks with a market capitalisation above $1bn and yielding more 3%.
If you spot an error that warrants correction, please contact the editor at editorial-team@simplywallst.com. This article by Simply Wall St is general in nature. It does not constitute a recommendation to buy or sell any stock, and does not take account of your objectives, or your financial situation. Simply Wall St has no position in the stocks mentioned.
We aim to bring you long-term focused research analysis driven by fundamental data. Note that our analysis may not factor in the latest price-sensitive company announcements or qualitative material. Thank you for reading.
