
 Yahoo Finance
 Gamma Communications (LON:GAMA) Looks To Prolong Its Impressive Returns
If we want to find a stock that could multiply over the long term, what are the underlying trends we should look for? Ideally, a business will show two trends; firstly a growing return on capital employed (ROCE) and secondly, an increasing amount of capital employed. This shows us that it's a compounding machine, able to continually reinvest its earnings back into the business and generate higher returns. Ergo, when we looked at the ROCE trends at Gamma Communications (LON:GAMA), we liked what we saw.
What Is Return On Capital Employed (ROCE)?
Just to clarify if you're unsure, ROCE is a metric for evaluating how much pre-tax income (in percentage terms) a company earns on the capital invested in its business. The formula for this calculation on Gamma Communications is:
Return on Capital Employed = Earnings Before Interest and Tax (EBIT) ÷ (Total Assets - Current Liabilities)
0.22 = UK£83m ÷ (UK£475m - UK£89m) (Based on the trailing twelve months to December 2023).
So, Gamma Communications has an ROCE of 22%. That's a fantastic return and not only that, it outpaces the average of 11% earned by companies in a similar industry.
See our latest analysis for Gamma Communications
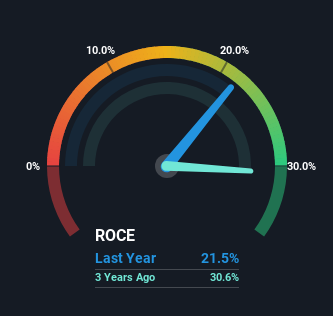
Above you can see how the current ROCE for Gamma Communications compares to its prior returns on capital, but there's only so much you can tell from the past. If you'd like to see what analysts are forecasting going forward, you should check out our free analyst report for Gamma Communications .
So How Is Gamma Communications' ROCE Trending?
In terms of Gamma Communications' history of ROCE, it's quite impressive. Over the past five years, ROCE has remained relatively flat at around 22% and the business has deployed 163% more capital into its operations. Returns like this are the envy of most businesses and given it has repeatedly reinvested at these rates, that's even better. If these trends can continue, it wouldn't surprise us if the company became a multi-bagger.
The Bottom Line On Gamma Communications' ROCE
In summary, we're delighted to see that Gamma Communications has been compounding returns by reinvesting at consistently high rates of return, as these are common traits of a multi-bagger. And given the stock has only risen 23% over the last five years, we'd suspect the market is beginning to recognize these trends. So to determine if Gamma Communications is a multi-bagger going forward, we'd suggest digging deeper into the company's other fundamentals.
Before jumping to any conclusions though, we need to know what value we're getting for the current share price. That's where you can check out our FREE intrinsic value estimation for GAMA that compares the share price and estimated value.
If you'd like to see other companies earning high returns, check out our free list of companies earning high returns with solid balance sheets here.
Have feedback on this article? Concerned about the content? Get in touch with us directly. Alternatively, email editorial-team (at) simplywallst.com.
This article by Simply Wall St is general in nature. We provide commentary based on historical data and analyst forecasts only using an unbiased methodology and our articles are not intended to be financial advice. It does not constitute a recommendation to buy or sell any stock, and does not take account of your objectives, or your financial situation. We aim to bring you long-term focused analysis driven by fundamental data. Note that our analysis may not factor in the latest price-sensitive company announcements or qualitative material. Simply Wall St has no position in any stocks mentioned.
