GBP/USD Daily Forecast – Sterling Recovers on Positive UK Data
UK Inflation Rises unexpectedly
A rise of 2.1% in annual CPI has lifted the British pound higher against its major counterparts. Analysts were expecting CPI to move up by 1.9% after it rose 2.0% in the prior reading.
The rise in prices certainly shows strength in the British economy. However, overshadowing Brexit uncertainties have tied the hands of policymakers. As such, tightening of monetary policy does not appear to be an option, even with inflation at these levels.
Aside from CPI, producer prices also beat expectations across the board, as did the retail price index. The only figure that missed expectations in today’s release was the annual house price index which rose 0.9% versus an expected 1.0%.
Technical analysis
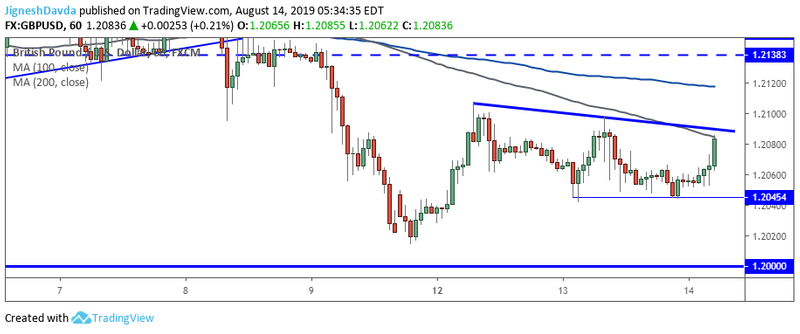
GBP/USD reversed higher after falling slightly short of testing major support at the 1.2000 handle this week. The pair has been in a strong downtrend on a daily chart, although is recovering in the early week.
The positive data today along with a slightly weaker dollar has lifted the pair higher and some important resistance has come into play. On an hourly chart, the pair is testing the 100 moving average. Slightly above the indicator, there is further resistance from a declining trendline that originates from a high posted earlier this week.

A break above this resistance area can open up the upside for a broader recovery. However, a strong downtrend has been in place for several months which suggests sellers will look to jump in at key resistance levels.
The 1.2050 area has acted as support twice in the early week already. This level remains support on any near-term dips.
Import prices will be released from the US later in the day. The data is not likely to have much of an impact on the exchange rate.
Bottom Line
GBP/USD has been trying to recover higher since an early week dip that fell slightly short of testing major support at 1.2000
The pair faces resistance from the 100 moving average on an hourly chart.
Additional resistance derives from a declining trendline that is found just above the indicator.
A light economic calendar today might keep the pair in the range that has played out since the pair hit a high two days ago.
This article was originally posted on FX Empire

 Yahoo Finance