
 Yahoo Finance
 GBP/USD Daily Forecast – Sterling Rises and Holds Above Critical Trendline
Technical Break Points to More Upside for GBP/USD
GBP/USD made a bullish break in the early week above a trendline that originates from a high printed in October. However, the pair proceeded lower in a two-day decline, threatening to break back below the trendline to invalidate the breakout.
But some late-day buying yesterday saved the pair from doing so. With some follow up today, it certainly appears like the pair is ready to resume high.
The pound to dollar exchange rate is benefiting from a weaker dollar as the greenback is seen declining against all of its major counterparts in early day trading.
The US Dollar index (DXY), in a similar fashion, reversed lower yesterday to give back a bulk of its daily gain. This has led to a reversal candlestick pattern on a daily chart to signal more downside for the dollar.
The Fed meeting minutes triggered some price swings in the dollar pairs yesterday but on net did not cause a sustained move. Policymakers signaled that they intend to stay put after cutting rates three times earlier in the year. The rhetoric of the minutes did not differ much from what was said in the press conference following the meeting.
Technical Analysis
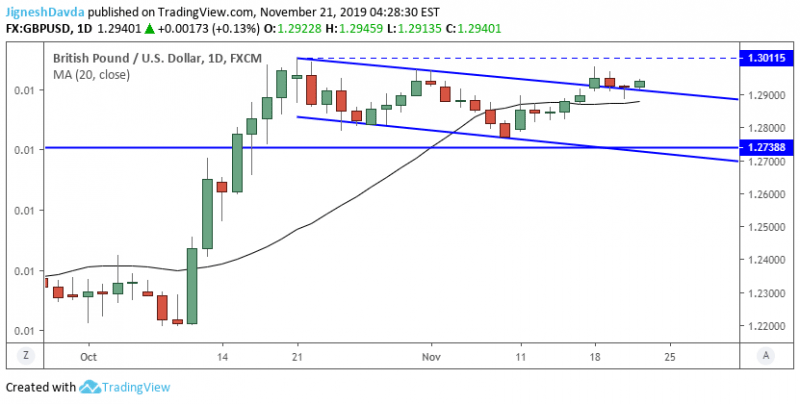
While it was a bit surprising that buyers didn’t jump in promptly to defend the broken trendline in GBP/USD, the end result is that they did. The candle print on a daily chart in relation to the trendline offers a bullish signal and I expect the pair will make its way once again to the psychological 1.3000 level.

On a 4-hour chart, the lower bound of a rising trend channel contained price action on yesterday’s dip. While the exchange rate remains above it, I expect it will continue to rise, in line with the broader pattern. A break below 1.2910, however, would turn the rising trend channel into a bear flag which would tend to signal more downside.
Bottom Line
GBP/USD has shown strength over the last 24 hours or so which leads me to believe it has resumed within the broader uptrend.
The next near-term target falls at 1.3000.
A break below 1.2910 invalidates the bullish near-term outlook.
This article was originally posted on FX Empire
