
 Yahoo Finance
 GBP/USD Extends Losses
Earlier today, the British pound extended losses against the greenback, which pushed GBP/USD to a fresh multi-month low. How low could the exchange rate go in the coming days?
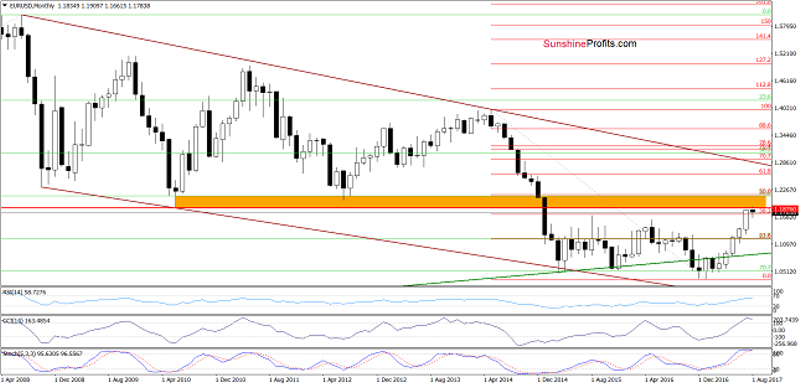
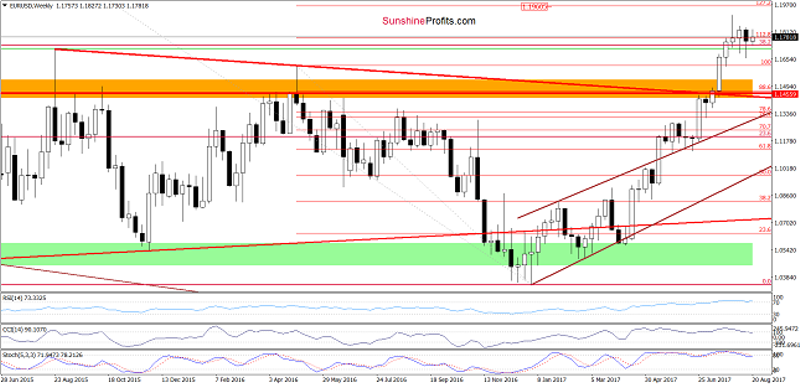
EUR/USD
Looking at the charts, we see that although EUR/USD moved a bit lower, the exchange rate is still trading around 38.2% Fibonacci retracement and the 112.8% Fibonacci extension. Nevertheless, the pair closed the previous week above the retracement and invalidated the earlier tiny breakdown under this support. Earlier this month, we saw a similar situation, which suggests that one more upswing and a re-test of the recent highs can’t be ruled out in the coming days.
Very short-term outlook: mixed
Short-term outlook: mixed
MT outlook: mixed
GBP/USD
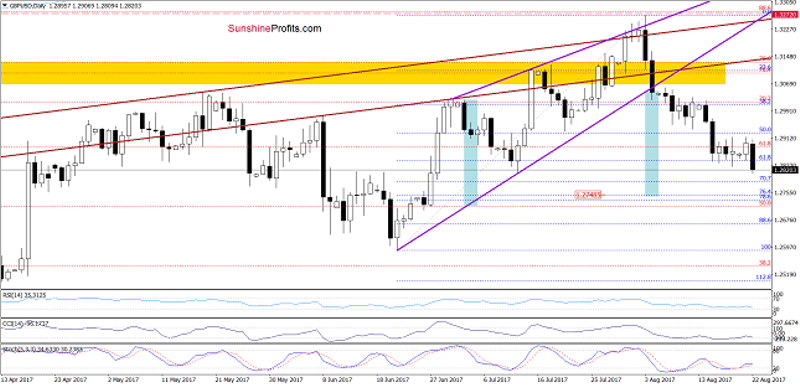
On Wednesday, we wrote that GBP/USD slipped to the lower border of the brown rising trend channel, which could encourage currency bulls to act.
But will we see such price action? In our opinion, it’s quite doubtful, because even if the exchange rate rebounds slightly from current levels, we should keep in mind all bearish technical factors. Firstly, the sell signals generated by the weekly indicators remain in place, supporting currency bears and further declines. Secondly, when we take a closer look at the daily chart (…), we see that the sell signals generated by the daily indicators also support lower values of GBP/USD.
Thirdly, the pair moved sharply lower (…) and broke below the 50% Fibonacci retracement yesterday, which resulted in a slip slightly below the 61.8% retracement. Fourthly, GBP/USD remains well below the yellow resistance zone and the lower border of the purple rising wedge. All the above-mentioned negative factors increase the probability that we’ll see a realization of the bearish scenario (…)

From today’s point of view, we see that although GBP/USD increased yesterday, currency bears took control earlier today, which triggered a pullback. As a result, the exchange rate dropped below the 61.8% Fibonacci retracement making our short positions even more profitable. Taking into account today’s price action and a drop below the lower border of the brown rising wedge marked on the weekly chart, we believe that we’ll see a realization of the bearish scenario from our Forex Trading Alert posted on August 7, 2017:
(….) if GBP/USD extends declines from current levels, we’ll see a drop to (at least) 1.2748, where the size of the downward move will correspond to the height of the rising wedge and where the 76.4% and 78.6% Fibonacci retracements are.
Very short-term outlook: bearish
Short-term outlook: bearish
MT outlook: mixed with bearish bias
AUD/USD
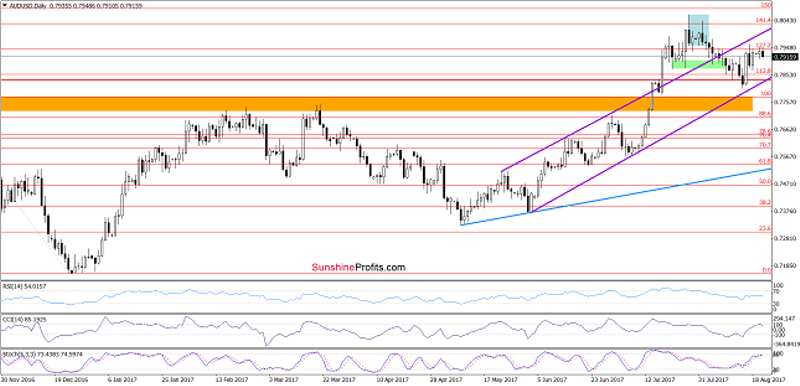
From today’s point of view, we see that the overall situation remains almost unchanged as AUD/USD is still trading in the purple rising trend channel between the yellow and orange zone seen on the weekly chart. What’s next? In our opinion, that even if the pair moves a bit higher from here (to the upper border of the purple rising trend channel marked on the daily chart), the current position of the weekly and daily indicators (the sell signals) suggests that the space for increases seems limited and bigger move to the downside may be just around the corner. If this is the case and we’ll see more reliable bearish factors, we’ll consider opening short positions.

Very short-term outlook: mixed
Short-term outlook: mixed
MT outlook: mixed
This article is written by Przemyslaw Radomski, a senior analyst at Sunshine Profits
This article was originally posted on FX Empire
