
 Yahoo Finance
 GBP/USD Price Forecast: A Move to $1.232 to Bring $1.24 into View
It is another quiet day on the UK economic calendar for the Pound., with no economic indicators to provide the GBP/USD with direction.
As we saw on Monday, the lack of stats will likely leave the GBP/USD pair in the hands of market risk sentiment.
On the monetary policy front, Bank of England MPC members could move the dial, with Jon Cunliffe due to speak later today. The markets will be looking for any deviation from the script on inflation, the economic outlook, and interest rates.
Last week’s private sector PMI numbers revealed rising input price pressures, with wage growth contributing. Wage growth is a BoE bugbear and one of two reasons for the BoE to make more aggressive policy moves to bring inflation under control.
GBP/USD Price Action
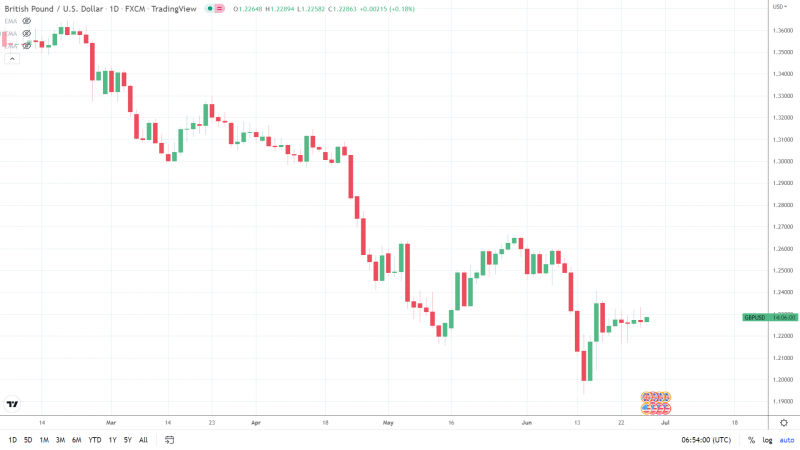
At the time of writing, the Pound was up 0.18% to $1.22863.
A mixed start to the day saw the Pound fall to an early low of $1.22582 before rising to a high of $1.22894.
The Pound left the Major Support and Resistance Levels untested early on.
Technical Indicators
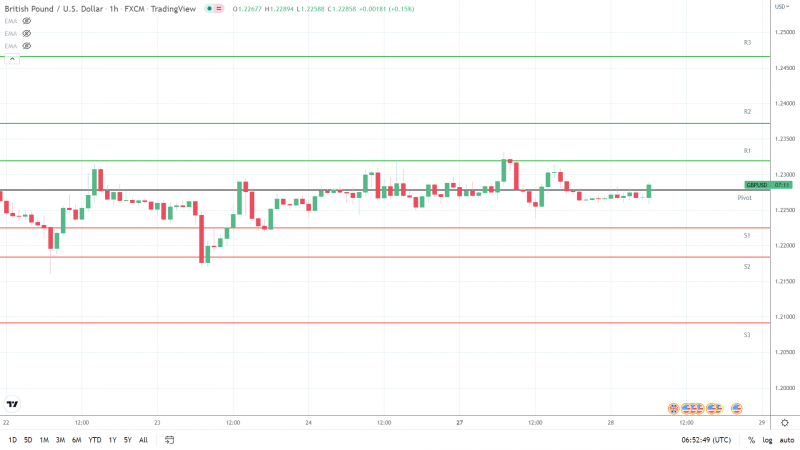
The Pound will need to avoid the $1.2278 pivot to target the First Major Resistance Level (R1) at $1.2319 and Monday’s high of $1.2332.
A pickup in market risk appetite would support a breakout from the morning high of $1.22894
An extended rally would test the Second Major Resistance Level (R2) at $1.2372 and resistance at $1.24. The Third Major Resistance Level (R3) sits at $1.2466.
A fall through the pivot would bring the First Major Support Level (S1)at $1.2225 into play.
Barring an extended sell-off, the Pound should steer clear of sub-$1.22 and the Second Major Support Level (S2) at $1.2184. The Third Major Support Level (S3) sits at $1.2091.
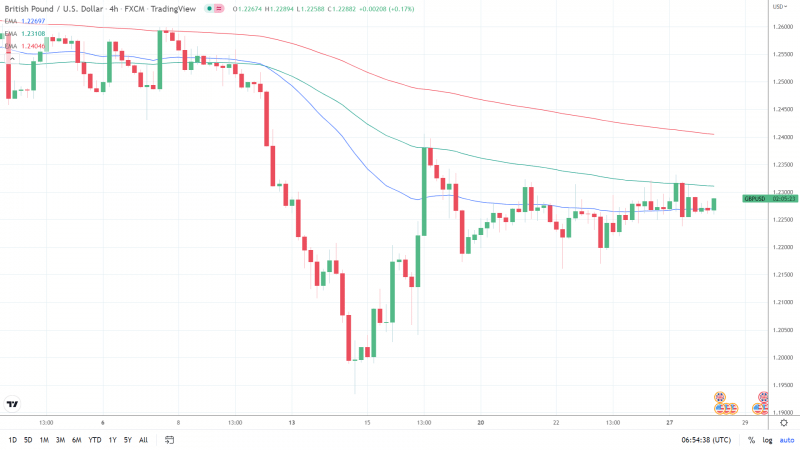
Looking at the EMAs and the 4-hourly candlestick chart (below), it is a bearish signal.
At the time of writing, the Pound sat above 50-day EMA, currently at $1.22697. The 50-day EMA eased back from the 100-day EMA. The 100-day EMA fell back from the 200-day EMA: GBP/USD negative.
A move back through the 100-day EMA, currently at $1.23108, would support a run at R2 and $1.24.
However, a GBP/USD fall through the 50-day EMA would bring $1.22 support into play.
The US Session
Economic data from the US include June consumer confidence figures. Following the Fed rate hike and recent Fed Chair Powell testimony, a slide in confidence would test support for riskier assets. For the GBP/USD pair, the Fed’s commitment to cut inflation at any cost could limit any dollar weakness.
This article was originally posted on FX Empire
