
 Yahoo Finance
 GBP/USD, USD/CAD, USD/MXN – North American Session Daily Forecast
GBP/USD
GBP/USD has posted gains on Tuesday, erasing most of the gains seen on Monday. In the North American session, the pair is trading at 1.2485, up 0.47% on the day.
Ahead – U.K. Inflation and Fed Meeting
There are no major indicators on the schedule, so investors are casting an eye ahead towards Wednesday, with key events on both sides of the pond. The U.K. will release the August consumer inflation report. Recent CPI releases have been around the 2.0% level, which is the Bank of England’s inflation target. However, inflation is expected to drop to 1.8% in August, and if CPI falls below this level, the pound could lose ground. As well, investors will be keeping a close eye on the Federal Reserve, which will set the benchmark rate and release a rate statement. Any hints about further rate cuts in 2019 could weigh on the U.S. dollar.
Technical Analysis
Since the start of the week, GBP/USD has hovered close to resistance at 1.2420. However, the pair has tested this line in the North American session. Will we see a clean break past this stubborn line? The pound remains in an area of resistance, with another resistance line at 1.2510. On the downside, there is resistance at 1.2380. This line is not particularly strong and is vulnerable if the pound coughs up Tuesday’s gains.

USD/CAD
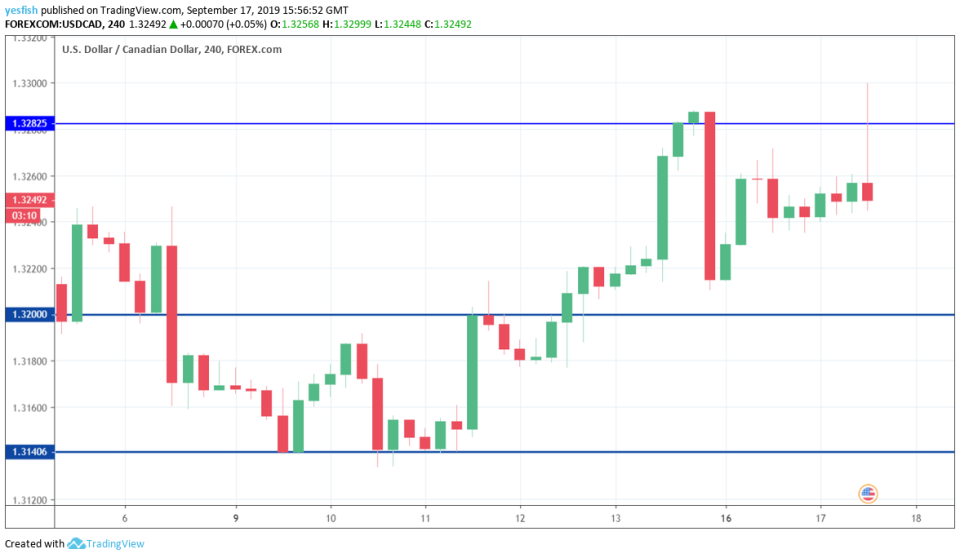
USD/CAD is showing limited movement on Tuesday. In the North American session, the pair is trading at 1.3259, up 0.13% on the day.
Soft Manufacturing Report Weighs on Loonie
Canada posted a weak manufacturing report on Tuesday, disappointing investors. Manufacturing sales declined 1.3% in July, well below expectations. This marked back-to-back declines for the key indicator, and will undoubtedly raise concerns about the health of the manufacturing sector.
Canadian CPI, Fed could Weigh on Loonie
Traders can expect stronger movement from USD/CAD on Wednesday. Canada releases CPI, with the markets braced for a decline of 0.2% in July. The Federal Reserve holds its monthly policy meeting, and a dovish message from rate-setters could rattle investors and push the Canadian dollar lower.
Technical Analysis
USD/CAD remains rangebound this week. The line of 1.3282 remains relevant and is providing weak resistance. On the downside, there is support at the round number of 1.3200.
USD/MXN
The Mexican peso seems unable to decide what to do, as the pair continues to drift this week. In the North American session, USD/MXN is trading at 19.41, down 0.13% on the day.
Will the Fed Meeting Shake Up Peso?
There are no major U.S. releases until Wednesday, so traders shouldn’t expect fundamentals to have much impact on USD/MXN in Tuesday trade. Investors will be keeping a close eye on the Federal Reserve, which will set the benchmark rate and release a rate statement on Wednesday. Any hints from Fed policymakers about further rate cuts in 2019 could dampen investor risk appetite and weigh on the Mexican peso.
Technical Analysis
The Mexican peso remains rangebound this week. The line of 19.45 remains fluid, and continues to be tested by USD/MXN. There is immediate support at 0.1920, which has held since August 1. On the upside, there is resistance at 19.70. If the pair can muster some strength and push above the 19.45 line, we could see an upward breakout from the pair.

This article was originally posted on FX Empire
