
 Yahoo Finance
 Can GE HealthCare Technologies Inc.'s (NASDAQ:GEHC) ROE Continue To Surpass The Industry Average?
While some investors are already well versed in financial metrics (hat tip), this article is for those who would like to learn about Return On Equity (ROE) and why it is important. To keep the lesson grounded in practicality, we'll use ROE to better understand GE HealthCare Technologies Inc. (NASDAQ:GEHC).
Return on equity or ROE is a key measure used to assess how efficiently a company's management is utilizing the company's capital. Simply put, it is used to assess the profitability of a company in relation to its equity capital.
See our latest analysis for GE HealthCare Technologies
How Is ROE Calculated?
Return on equity can be calculated by using the formula:
Return on Equity = Net Profit (from continuing operations) ÷ Shareholders' Equity
So, based on the above formula, the ROE for GE HealthCare Technologies is:
21% = US$1.6b ÷ US$7.6b (Based on the trailing twelve months to March 2024).
The 'return' is the income the business earned over the last year. One way to conceptualize this is that for each $1 of shareholders' capital it has, the company made $0.21 in profit.
Does GE HealthCare Technologies Have A Good Return On Equity?
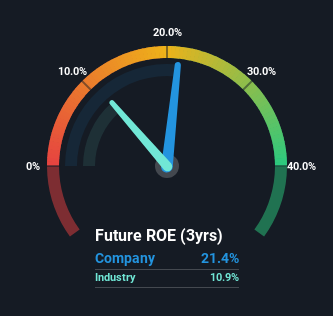
Arguably the easiest way to assess company's ROE is to compare it with the average in its industry. However, this method is only useful as a rough check, because companies do differ quite a bit within the same industry classification. As you can see in the graphic below, GE HealthCare Technologies has a higher ROE than the average (11%) in the Medical Equipment industry.
That's what we like to see. With that said, a high ROE doesn't always indicate high profitability. Especially when a firm uses high levels of debt to finance its debt which may boost its ROE but the high leverage puts the company at risk.
Why You Should Consider Debt When Looking At ROE
Companies usually need to invest money to grow their profits. That cash can come from retained earnings, issuing new shares (equity), or debt. In the first two cases, the ROE will capture this use of capital to grow. In the latter case, the debt required for growth will boost returns, but will not impact the shareholders' equity. In this manner the use of debt will boost ROE, even though the core economics of the business stay the same.
Combining GE HealthCare Technologies' Debt And Its 21% Return On Equity
GE HealthCare Technologies does use a high amount of debt to increase returns. It has a debt to equity ratio of 1.22. There's no doubt its ROE is decent, but the very high debt the company carries is not too exciting to see. Debt increases risk and reduces options for the company in the future, so you generally want to see some good returns from using it.
Conclusion
Return on equity is useful for comparing the quality of different businesses. In our books, the highest quality companies have high return on equity, despite low debt. If two companies have around the same level of debt to equity, and one has a higher ROE, I'd generally prefer the one with higher ROE.
But ROE is just one piece of a bigger puzzle, since high quality businesses often trade on high multiples of earnings. The rate at which profits are likely to grow, relative to the expectations of profit growth reflected in the current price, must be considered, too. So you might want to check this FREE visualization of analyst forecasts for the company.
Of course, you might find a fantastic investment by looking elsewhere. So take a peek at this free list of interesting companies.
Have feedback on this article? Concerned about the content? Get in touch with us directly. Alternatively, email editorial-team (at) simplywallst.com.
This article by Simply Wall St is general in nature. We provide commentary based on historical data and analyst forecasts only using an unbiased methodology and our articles are not intended to be financial advice. It does not constitute a recommendation to buy or sell any stock, and does not take account of your objectives, or your financial situation. We aim to bring you long-term focused analysis driven by fundamental data. Note that our analysis may not factor in the latest price-sensitive company announcements or qualitative material. Simply Wall St has no position in any stocks mentioned.
