
 Yahoo Finance
 Gelsenwasser (FRA:WWG) Has More To Do To Multiply In Value Going Forward
If you're looking for a multi-bagger, there's a few things to keep an eye out for. Firstly, we'd want to identify a growing return on capital employed (ROCE) and then alongside that, an ever-increasing base of capital employed. Put simply, these types of businesses are compounding machines, meaning they are continually reinvesting their earnings at ever-higher rates of return. Although, when we looked at Gelsenwasser (FRA:WWG), it didn't seem to tick all of these boxes.
What Is Return On Capital Employed (ROCE)?
For those that aren't sure what ROCE is, it measures the amount of pre-tax profits a company can generate from the capital employed in its business. Analysts use this formula to calculate it for Gelsenwasser:
Return on Capital Employed = Earnings Before Interest and Tax (EBIT) ÷ (Total Assets - Current Liabilities)
0.028 = €66m ÷ (€4.3b - €1.9b) (Based on the trailing twelve months to June 2023).
Therefore, Gelsenwasser has an ROCE of 2.8%. In absolute terms, that's a low return and it also under-performs the Integrated Utilities industry average of 5.9%.
View our latest analysis for Gelsenwasser
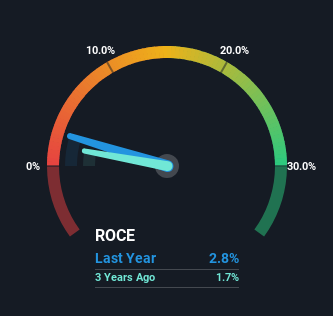
Historical performance is a great place to start when researching a stock so above you can see the gauge for Gelsenwasser's ROCE against it's prior returns. If you want to delve into the historical earnings , check out these free graphs detailing revenue and cash flow performance of Gelsenwasser.
What Can We Tell From Gelsenwasser's ROCE Trend?
There are better returns on capital out there than what we're seeing at Gelsenwasser. The company has consistently earned 2.8% for the last five years, and the capital employed within the business has risen 69% in that time. This poor ROCE doesn't inspire confidence right now, and with the increase in capital employed, it's evident that the business isn't deploying the funds into high return investments.
On another note, while the change in ROCE trend might not scream for attention, it's interesting that the current liabilities have actually gone up over the last five years. This is intriguing because if current liabilities hadn't increased to 46% of total assets, this reported ROCE would probably be less than2.8% because total capital employed would be higher.The 2.8% ROCE could be even lower if current liabilities weren't 46% of total assets, because the the formula would show a larger base of total capital employed. Additionally, this high level of current liabilities isn't ideal because it means the company's suppliers (or short-term creditors) are effectively funding a large portion of the business.
The Bottom Line On Gelsenwasser's ROCE
As we've seen above, Gelsenwasser's returns on capital haven't increased but it is reinvesting in the business. And in the last five years, the stock has given away 11% so the market doesn't look too hopeful on these trends strengthening any time soon. Therefore based on the analysis done in this article, we don't think Gelsenwasser has the makings of a multi-bagger.
Gelsenwasser does have some risks, we noticed 3 warning signs (and 1 which makes us a bit uncomfortable) we think you should know about.
For those who like to invest in solid companies, check out this free list of companies with solid balance sheets and high returns on equity.
Have feedback on this article? Concerned about the content? Get in touch with us directly. Alternatively, email editorial-team (at) simplywallst.com.
This article by Simply Wall St is general in nature. We provide commentary based on historical data and analyst forecasts only using an unbiased methodology and our articles are not intended to be financial advice. It does not constitute a recommendation to buy or sell any stock, and does not take account of your objectives, or your financial situation. We aim to bring you long-term focused analysis driven by fundamental data. Note that our analysis may not factor in the latest price-sensitive company announcements or qualitative material. Simply Wall St has no position in any stocks mentioned.
