
 Yahoo Finance
 Has Genting Singapore Limited (SGX:G13) Got Enough Cash?

Want to participate in a short research study? Help shape the future of investing tools and you could win a $250 gift card!
Stocks with market capitalization between $2B and $10B, such as Genting Singapore Limited (SGX:G13) with a size of S$12b, do not attract as much attention from the investing community as do the small-caps and large-caps. However, generally ignored mid-caps have historically delivered better risk adjusted returns than both of those groups. Let’s take a look at G13’s debt concentration and assess their financial liquidity to get an idea of their ability to fund strategic acquisitions and grow through cyclical pressures. Remember this is a very top-level look that focuses exclusively on financial health, so I recommend a deeper analysis into G13 here.
View our latest analysis for Genting Singapore
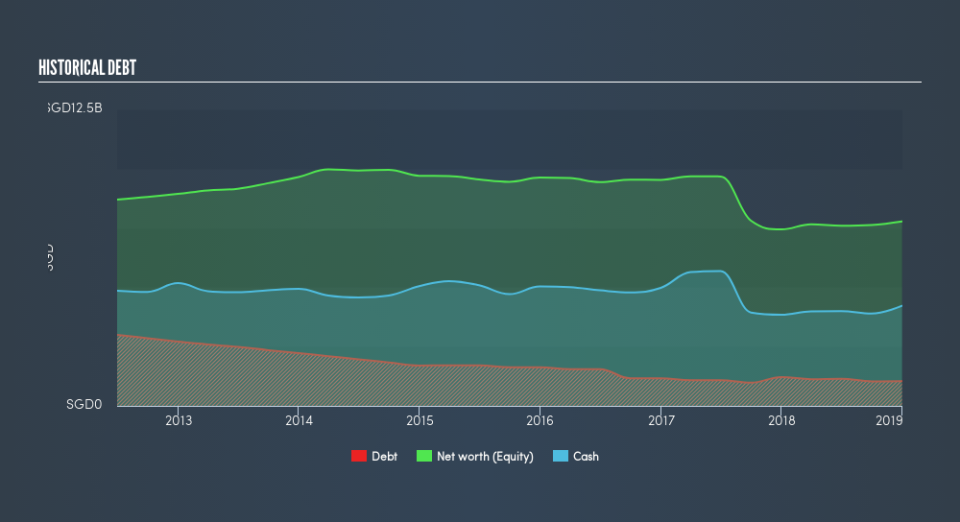
G13’s Debt (And Cash Flows)
G13 has shrunk its total debt levels in the last twelve months, from S$1.2b to S$1.0b – this includes long-term debt. With this debt repayment, G13 currently has S$4.2b remaining in cash and short-term investments , ready to be used for running the business. Additionally, G13 has generated cash from operations of S$1.1b in the last twelve months, resulting in an operating cash to total debt ratio of 110%, meaning that G13’s current level of operating cash is high enough to cover debt.
Can G13 meet its short-term obligations with the cash in hand?
Looking at G13’s S$863m in current liabilities, it seems that the business has been able to meet these commitments with a current assets level of S$4.5b, leading to a 5.25x current account ratio. The current ratio is calculated by dividing current assets by current liabilities. Having said that, a ratio greater than 3x may be considered by some to be quite high, however this is not necessarily a negative for the company.
Can G13 service its debt comfortably?
With a debt-to-equity ratio of 13%, G13's debt level may be seen as prudent. G13 is not taking on too much debt commitment, which can be restrictive and risky for equity-holders.
Next Steps:
G13’s high cash coverage and low debt levels indicate its ability to utilise its borrowings efficiently in order to generate ample cash flow. In addition to this, the company will be able to pay all of its upcoming liabilities from its current short-term assets. Keep in mind I haven't considered other factors such as how G13 has been performing in the past. You should continue to research Genting Singapore to get a more holistic view of the stock by looking at:
Future Outlook: What are well-informed industry analysts predicting for G13’s future growth? Take a look at our free research report of analyst consensus for G13’s outlook.
Historical Performance: What has G13's returns been like over the past? Go into more detail in the past track record analysis and take a look at the free visual representations of our analysis for more clarity.
Other High-Performing Stocks: Are there other stocks that provide better prospects with proven track records? Explore our free list of these great stocks here.
We aim to bring you long-term focused research analysis driven by fundamental data. Note that our analysis may not factor in the latest price-sensitive company announcements or qualitative material.
If you spot an error that warrants correction, please contact the editor at editorial-team@simplywallst.com. This article by Simply Wall St is general in nature. It does not constitute a recommendation to buy or sell any stock, and does not take account of your objectives, or your financial situation. Simply Wall St has no position in the stocks mentioned. Thank you for reading.
