
 Yahoo Finance
 Glencore plc (LON:GLEN) Is Yielding 6.5% - But Is It A Buy?

Could Glencore plc (LON:GLEN) be an attractive dividend share to own for the long haul? Investors are often drawn to strong companies with the idea of reinvesting the dividends. If you are hoping to live on the income from dividends, it's important to be a lot more stringent with your investments than the average punter.
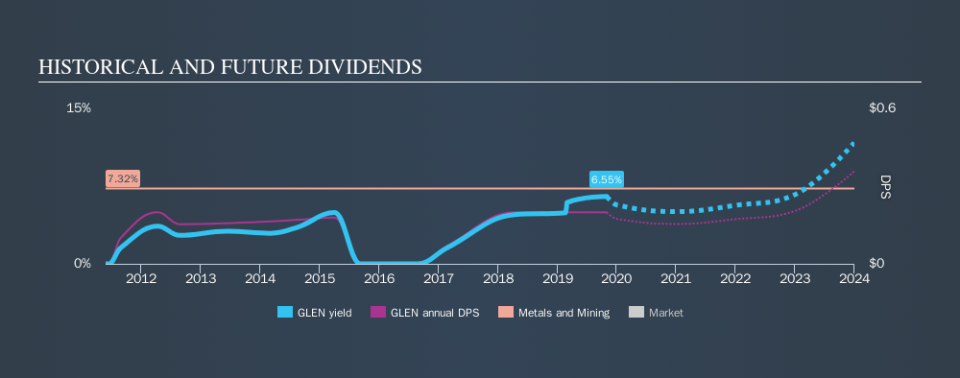
In this case, Glencore likely looks attractive to dividend investors, given its 6.5% dividend yield and eight-year payment history. It sure looks interesting on these metrics - but there's always more to the story . The company also bought back stock during the year, equivalent to approximately 7.2% of the company's market capitalisation at the time. Before you buy any stock for its dividend however, you should always remember Warren Buffett's two rules: 1) Don't lose money, and 2) Remember rule #1. We'll run through some checks below to help with this.
Explore this interactive chart for our latest analysis on Glencore!
Payout ratios
Dividends are usually paid out of company earnings. If a company is paying more than it earns, then the dividend might become unsustainable - hardly an ideal situation. Comparing dividend payments to a company's net profit after tax is a simple way of reality-checking whether a dividend is sustainable. In the last year, Glencore paid out 323% of its profit as dividends. A payout ratio above 100% is definitely an item of concern, unless there are some other circumstances that would justify it.
In addition to comparing dividends against profits, we should inspect whether the company generated enough cash to pay its dividend. Glencore's cash payout ratio in the last year was 43%, which suggests dividends were well covered by cash generated by the business. It's disappointing to see that the dividend was not covered by profits, but cash is more important from a dividend sustainability perspective, and Glencore fortunately did generate enough cash to fund its dividend. If executives were to continue paying more in dividends than the company reported in profits, we'd view this as a warning sign. Extraordinarily few companies are capable of persistently paying a dividend that is greater than their profits.
Is Glencore's Balance Sheet Risky?
As Glencore's dividend was not well covered by earnings, we need to check its balance sheet for signs of financial distress. A rough way to check this is with these two simple ratios: a) net debt divided by EBITDA (earnings before interest, tax, depreciation and amortisation), and b) net interest cover. Net debt to EBITDA measures total debt load relative to company earnings (lower = less debt), while net interest cover measures the ability to pay interest on the debt (higher = greater ability to pay interest costs). With net debt of 2.67 times its EBITDA, Glencore has a noticeable amount of debt, although if business stays steady, this may not be overly concerning.
We calculated its interest cover by measuring its earnings before interest and tax (EBIT), and dividing this by the company's net interest expense. Interest cover of 2.89 times its interest expense is starting to become a concern for Glencore, and be aware that lenders may place additional restrictions on the company as well.
Remember, you can always get a snapshot of Glencore's latest financial position, by checking our visualisation of its financial health.
Dividend Volatility
One of the major risks of relying on dividend income, is the potential for a company to struggle financially and cut its dividend. Not only is your income cut, but the value of your investment declines as well - nasty. Looking at the last decade of data, we can see that Glencore paid its first dividend at least eight years ago. It's good to see that Glencore has been paying a dividend for a number of years. However, the dividend has been cut at least once in the past, and we're concerned that what has been cut once, could be cut again. During the past eight-year period, the first annual payment was US$0.10 in 2011, compared to US$0.20 last year. Dividends per share have grown at approximately 9.1% per year over this time. Glencore's dividend payments have fluctuated, so it hasn't grown 9.1% every year, but the CAGR is a useful rule of thumb for approximating the historical growth.
A reasonable rate of dividend growth is good to see, but we're wary that the dividend history is not as solid as we'd like, having been cut at least once.
Dividend Growth Potential
With a relatively unstable dividend, it's even more important to see if earnings per share (EPS) are growing. Why take the risk of a dividend getting cut, unless there's a good chance of bigger dividends in future? It's good to see Glencore has been growing its earnings per share at 28% a year over the past five years. The company has been growing its EPS at a very rapid rate, while paying out virtually all of its income as dividends. Generally, a company that is growing rapidly while paying out a majority of its earnings, is seeing its debt burden increase. We'd be conscious of any extra risk added by this practice.
Conclusion
When we look at a dividend stock, we need to form a judgement on whether the dividend will grow, if the company is able to maintain it in a wide range of economic circumstances, and if the dividend payout is sustainable. We're a bit uncomfortable with its high payout ratio, although at least the dividend was covered by free cash flow. Next, earnings growth has been good, but unfortunately the dividend has been cut at least once in the past. While we're not hugely bearish on it, overall we think there are potentially better dividend stocks than Glencore out there.
Earnings growth generally bodes well for the future value of company dividend payments. See if the 16 Glencore analysts we track are forecasting continued growth with our free report on analyst estimates for the company.
We have also put together a list of global stocks with a market capitalisation above $1bn and yielding more 3%.
We aim to bring you long-term focused research analysis driven by fundamental data. Note that our analysis may not factor in the latest price-sensitive company announcements or qualitative material.
If you spot an error that warrants correction, please contact the editor at editorial-team@simplywallst.com. This article by Simply Wall St is general in nature. It does not constitute a recommendation to buy or sell any stock, and does not take account of your objectives, or your financial situation. Simply Wall St has no position in the stocks mentioned. Thank you for reading.
