
 Yahoo Finance
Global Kaolin Market (2022 to 2030) - Size, Share & Trends Analysis Report

Global Kaolin Market
Dublin, June 03, 2022 (GLOBE NEWSWIRE) -- The "Kaolin Market Size, Share & Trends Analysis Report by Application (Paper, Ceramics, Paint & Coatings, Fiber Glass, Plastic, Rubber, Cosmetics), by Region, and Segment Forecasts, 2022-2030" report has been added to ResearchAndMarkets.com's offering.
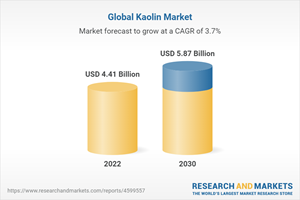
The global kaolin market size is projected to reach approximately USD 5.87 billion by 2030., progressing at a CAGR of 3.7% in the forecast period. The rising prominence of kaolin especially in the manufacturing of whiteware ceramics is projected to aid the market growth over the predicted timeline.
According to the stats released by the United States Geological Survey (USGS) in 2022, the global production of kaolin was estimated at around 46 million tons in 2020. The key kaolin-producing countries are the U.S., Uzbekistan, China, India, Germany, the Czech Republic, and others. Among these countries, India was the front runner with a total estimated production volume of approximately 7.6 million tons in 2020.
Key global players in the kaolin industry include BASF SE, Sibelco, and Imerys SA. There are no significant merger & acquisition activities observed in recent years. Although, Sibelco N.V. and Thiele Kaolin Company initiated some acquisition activities in order to expand their product portfolio and diversify their business. These activities are projected to result in the consolidation of the industry over the coming years.
However, most of the players in the market are focused on increasing kaolin prices in order to ensure the long-term sustainability of the business. These players announced an increase in prices by 4% to 9% in 2021 for different applications, in which paper was a key application. Most of the companies experienced inflation in different aspects of the business including inflation in chemicals and freight costs. In addition, the downgrade caused due to the breakout of the pandemic from key application sectors directly impacted the revenue earnings of major market participants in 2020.
An increase in prices is projected to create less impact on the demand of kaolin, as this increase was initiated by most of the small, medium, and large companies across the globe. Imerys and BASF SE emerged among the top players in this market space. Imerys S.A. was established in 1880 and is engaged in the manufacture and marketing of kaolin products. The company is involved in the development of new products to maintain a strong hold over the global market with production facilities in the U.S., the UK, Brazil, Sweden, and France.
Kaolin Market Report Highlights
by application, the paper generated a revenue of approximately USD 1.56 billion in 2021. This growth is largely attributed to the growth in demand for paper packaging, especially for food deliveries. The work from home concept initiated due to the emergence of the pandemic directly prospered the demand for paper materials, thereby, positively aiding the kaolin industry.
The ceramic application segment in terms of volume accounted for nearly 33.1% of the global product demand in 2021. The temporary shutdown during the first half of 2020 impacted the ceramics business volume, especially in the construction sector.
The regional demand was primarily dominated by the Asia Pacific region which is projected to progress at a compounded annual growth rate of nearly 4.5% in terms of revenue over the forecast period.
Europe is estimated to emerge as the second-largest regional market with a total volumetric share of nearly 33.8% in 2021. The economic impact caused due to the COVID-19 in the European region is likely to trigger a slow growth for kaolin products over the forecast period.
Key Topics Covered:
Chapter 1. Methodology and Scope
Chapter 2. Executive Summary
Chapter 3. Market Variables, Trends, and Scope
3.1. Penetration & Growth Prospect Mapping
3.2. Industry Value Chain Analysis
3.2.1. Raw Material Trends
3.2.2. Manufacturing Trends
3.2.3. Sales Channel Analysis
3.3. Regulatory Framework
3.4. Import & export analysis
3.5. Kaolin Market- Market Dynamics
3.5.1. Market Driver Analysis
3.5.2. Market Restraint Analysis
3.5.3. Industry Challenges
3.6. Business Environmental Tools Analysis: Kaolin Market
3.6.1. Porter's Five Forces Analysis
3.6.1.1. Bargaining Power of Suppliers
3.6.1.2. Bargaining Power of Buyers
3.6.1.3. Threat of Substitution
3.6.1.4. Threat of New Entrants
3.6.1.5. Competitive Rivalry
3.6.2. PESTLE Analysis
3.6.2.1. Political Landscape
3.6.2.2. Economic Landscape
3.6.2.3. Social Landscape
3.6.2.4. Technology Landscape
3.6.2.5. Environmental Landscape
3.6.2.6. Legal Landscape
3.7. Major Strategic Deals & Alliances
Chapter 4. Kaolin Market: Application Estimates & Trend Analysis
4.1. Kaolin Market: Application Movement Analysis, 2021 & 2030
4.2. Paper
4.2.1. Market estimates and forecasts, 2017-2030 (Kilotons) (USD Million)
4.3. Ceramics
4.3.1. Market estimates and forecasts, 2017-2030 (Kilotons) (USD Million)
4.4. Paints & Coatings
4.4.1. Market estimates and forecasts, 2017-2030 (Kilotons) (USD Million)
4.5. Fiberglass
4.5.1. Market estimates and forecasts, 2017-2030 (Kilotons) (USD Million)
4.6. Plastic
4.6.1. Market estimates and forecasts, 2017-2030 (Kilotons) (USD Million)
4.7. Rubber
4.7.1. Market estimates and forecasts, 2017-2030 (Kilotons) (USD Million)
4.8. Pharmaceutical & Medical
4.8.1. Market estimates and forecasts, 2017-2030 (Kilotons) (USD Million)
4.9. Cosmetics
4.9.1. Market estimates and forecasts, 2017-2030 (Kilotons) (USD Million)
4.10. Others
4.10.1. Market estimates and forecasts, 2017-2030 (Kilotons) (USD Million)
Chapter 5. Kaolin Market: Regional Estimates & Trend Analysis
Chapter 6. Competitive Landscape
6.1. Key Global Players, Their Initiatives, & Its Impact on the Market
6.2. Vendor Landscape
6.3. Company Market Position Analysis
6.4. Strategic Framework
Chapter 7. Company Profiles
7.1. BASF SE
7.1.1. Company overview
7.1.2. Financial performance
7.1.3. Application benchmarking
7.1.4. Strategic initiatives
7.2. LB Minerals Ltd.
7.2.1. Company overview
7.2.2. Financial performance
7.2.3. Application benchmarking
7.2.4. Strategic initiatives
7.3. Sibelco N.V.
7.3.1. Company overview
7.3.2. Financial performance
7.3.3. Application benchmarking
7.3.4. Strategic initiatives
7.4. KaMin LLC
7.4.1. Company overview
7.4.2. Financial performance
7.4.3. Application benchmarking
7.4.4. Strategic initiatives
7.5. Thiele Kaolin Company
7.5.1. Company overview
7.5.2. Financial performance
7.5.3. Application benchmarking
7.5.4. Strategic initiatives
7.6. Imerys S.A.
7.6.1. Company overview
7.6.2. Financial performance
7.6.3. Application benchmarking
7.6.4. Strategic initiatives
7.7. I-Minerals, Inc.
7.7.1. Company overview
7.7.2. Financial performance
7.7.3. Application benchmarking
7.7.4. Strategic initiatives
7.8. Quarzwerke GmbH
7.8.1. Company overview
7.8.2. Financial performance
7.8.3. Application benchmarking
7.8.4. Strategic initiatives
7.9. Maoming Xingli Kaolin Co., Ltd.
7.9.1. Company overview
7.9.2. Financial performance
7.9.3. Application benchmarking
7.9.4. Strategic initiatives
7.10. Guangdong Highsun Yongye Group Co., Ltd.
7.10.1. Company overview
7.10.2. Financial performance
7.10.3. Application benchmarking
7.10.4. Strategic initiatives
For more information about this report visit https://www.researchandmarkets.com/r/ue3ow0
Attachment
CONTACT: CONTACT: ResearchAndMarkets.com Laura Wood, Senior Press Manager press@researchandmarkets.com For E.S.T Office Hours Call 1-917-300-0470 For U.S./CAN Toll Free Call 1-800-526-8630 For GMT Office Hours Call +353-1-416-8900

