
 Yahoo Finance
Global Network Functions Virtualization Market (2022 to 2030) - Size, Share & Trends Analysis Report

Global Network Functions Virtualization Market
Dublin, Aug. 30, 2022 (GLOBE NEWSWIRE) -- The "Global Network Functions Virtualization Market Size, Share & Trends Analysis Report by Component, by Organization Size, by Applications, by End-user (Service Providers, Data Centers, Enterprises), by Region, and Segment Forecasts, 2022-2030" report has been added to ResearchAndMarkets.com's offering.
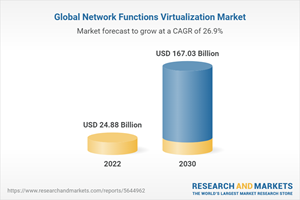
The global network functions virtualization market size is anticipated to reach USD 167.03 billion by 2030, registering a CAGR of 26.9% over the forecast period. The market is anticipated to witness significant growth over the forecast period, ascribed to the increased deployment of virtualized software in enterprise data centers.
The network functions virtualization market is characterized by the ability to manage and orchestrate the virtual resources to provide network functions and their composition into higher-layer network services. Innovation and advancement are primarily driven by the growing demand for network function virtualizations across the U.S.
Security issues such as insolation failure risk, regulatory compliance failure, and denial of service protection failure, among other security issues about network functions virtualization, are anticipated to restrain the market growth.
The network functions virtualization component outlook segment is expected to witness significant growth. The component outlook segment consists of solutions and services. The solution segment is estimated to witness the largest share. This growth is ascribed to increasing IT productivity and demand for network virtualization software compliant to run on standard server platforms.
The organization size segment comprises small & medium enterprises and large enterprises. The large-scale enterprises are estimated to yield significant market share, owing to the growing significance of network infrastructure and rising demand for affordable and better hardware and software required for NFV.
The application segment comprises virtual appliances and a core network. The virtual appliance segment is estimated to yield the most significant share owing to the increasing demand for automation and the growing number of network complexities and virtualization.
Under the end-user segment, the service providers are rapidly adopting NFV. The adoption has enabled to leverage of its significant benefits such as network customization, a centralized network that allows improved network efficiency, and enhanced IT agility.
Network Functions Virtualization Market Report Highlights
The market is expected to witness a CAGR of 26.9% over the next eight years, owing to the increasing deployment of virtualized software in enterprise data centers globally
The solution segment accounted for the largest revenue share of over 74.0% in 2021. The rising demand for network virtualization is the major factor influencing market growth
Increasing IT productivity, distinctively in developing economies, has considerably contributed to the market's growth
The large-scale organization size segment is expected to witness a significant CAGR of 26.3% over the forecast period owing to rising demand for affordable and better software and hardware required for network functions virtualization
The virtual appliance application segment was expected to dominate the market segment in 2021 and is expected to witness a CAGR of 28.2% over the conjecture owing to the numerous benefits accessible by network functions virtualization
The Asia Pacific dominated the market in 2021 and accounted for the largest revenue share of more than 34.0%, owing to the extensive adoption of network functions virtualization in the region
Key Topics Covered:
Chapter 1. Methodology and Scope
Chapter 2. Executive Summary
Chapter 3. Market Variables, Trends, & Scope Outlook
3.1. Market Segmentation
3.2. Network Functions Virtualization Market Size & Growth Prospects
3.3. Network Functions Virtualization Market - Value Chain Analysis
3.4. Network Functions Virtualization Market Trends
3.4.1. Technology Trends
3.4.2. Regulatory Trends
3.4.3. Buyers Trends
3.4.4. Suppliers Trends
3.5. Network Functions Virtualization Market Dynamics
3.5.1. Market Driver Analysis
3.5.2. Market Restraint Analysis
3.5.3. Market Opportunity Analysis
3.6. Network Functions Virtualization Market - Porter's Five Forces Analysis
3.6.1. Supplier power
3.6.2. Buyer power
3.6.3. Substitution threat
3.6.4. Threat from new entrant
3.6.5. Competitive rivalry
3.7. Network Functions Virtualization Market - PEST Analysis
3.7.1. Political landscape
3.7.2. Economic landscape
3.7.3. Social landscape
3.7.4. Technology landscape
3.8. Impact of COVID-19 on the Network Functions Virtualization Market
Chapter 4. Network Functions Virtualization Component Outlook
4.1. Network Functions Virtualization Market, By Component Analysis & Market Share, 2021 & 2030
4.2. Solutions
4.2.1. Market estimates and forecasts, 2017 - 2030 (USD Million)
4.2.2. Market estimates and forecasts, By Region, 2017 - 2030 (USD Million)
4.3. Services
4.3.1. Market estimates and forecasts, 2017 - 2030 (USD Million)
4.3.2. Market estimates and forecasts, By Region, 2017 - 2030 (USD Million)
Chapter 5. Network Functions Virtualization Organization Size Outlook
5.1. Network Functions Virtualization Market, By Organization Size Analysis & Market Share, 2021 & 2030
5.2. Small & Medium Enterprises
5.2.1. Market estimates and forecasts, 2017 - 2030 (USD Million)
5.2.2. Market estimates and forecasts, By Region, 2017 - 2030 (USD Million)
5.3. Large Enterprises
5.3.1. Market estimates and forecasts, 2017 - 2030 (USD Million)
5.3.2. Market estimates and forecasts, By Region, 2017 - 2030 (USD Million)
Chapter 6. Network Functions Virtualization Application Outlook
6.1. Network Functions Virtualization market, By Application Analysis & Market Share, 2021 & 2030
6.2. Virtual Appliance
6.2.1. Market estimates and forecasts, 2017 - 2030 (USD Million)
6.2.2. Market estimates and forecasts, By Region, 2017 - 2030 (USD Million)
6.3. Core Network
6.3.1. Market estimates and forecasts, 2017 - 2030 (USD Million)
6.3.2. Market estimates and forecasts, By Region, 2017 - 2030 (USD Million)
Chapter 7. Network Functions Virtualization End-User Outlook
7.1. Network Functions Virtualization market, By End-User Analysis & Market Share, 2021 & 2030
7.2. Service Providers
7.2.1. Market estimates and forecasts, 2017 - 2030 (USD Million)
7.2.2. Market estimates and forecasts, By Region, 2017 - 2030 (USD Million)
7.3. Data Centers
7.3.1. Market estimates and forecasts, 2017 - 2030 (USD Million)
7.3.2. Market estimates and forecasts, By Region, 2017 - 2030 (USD Million)
7.4. Enterprises
7.4.1. Market estimates and forecasts, 2017 - 2030 (USD Million)
7.4.2. Market estimates and forecasts, By Region, 2017 - 2030 (USD Million)
7.4.3. Banking, Financial Services and Insurance (BFSI)
7.4.3.1. Market estimates and forecasts, 2017 - 2030 (USD Million)
7.4.3.2. Market estimates and forecasts, By Region, 2017 - 2030 (USD Million)
7.4.4. Healthcare
7.4.4.1. Market estimates and forecasts, 2017 - 2030 (USD Million)
7.4.4.2. Market estimates and forecasts, By Region, 2017 - 2030 (USD Million)
7.4.5. Retail
7.4.5.1. Market estimates and forecasts, 2017 - 2030 (USD Million)
7.4.5.2. Market estimates and forecasts, By Region, 2017 - 2030 (USD Million)
7.4.6. Manufacturing
7.4.6.1. Market estimates and forecasts, 2017 - 2030 (USD Million)
7.4.6.2. Market estimates and forecasts, By Region, 2017 - 2030 (USD Million)
7.4.7. Government and Defense
7.4.7.1. Market estimates and forecasts, 2017 - 2030 (USD Million)
7.4.7.2. Market estimates and forecasts, By Region, 2017 - 2030 (USD Million)
7.4.8. Education
7.4.8.1. Market estimates and forecasts, 2017 - 2030 (USD Million)
7.4.8.2. Market estimates and forecasts, By Region, 2017 - 2030 (USD Million)
7.4.9. Others
7.4.9.1. Market estimates and forecasts, 2017 - 2030 (USD Million)
7.4.9.2. Market estimates and forecasts, By Region, 2017 - 2030 (USD Million)
Chapter 8. Network Functions Virtualization Market: Regional Estimates & Trend Analysis
Chapter 9. Competitive Analysis
9.1. Recent Developments and Impact Analysis, by Key Market Participants
9.2. Company/Competition Categorization (Key Innovators, Market Leaders, Emerging, Niche Players)
9.3. Vendor Landscape
9.3.1. Key company market share analysis, 2021
9.4. Company Analysis Tools
9.4.1. Market Position Analysis
9.4.2. Competitive Dashboard Analysis
Chapter 10. Competitive Landscape
10.1. Company Profiles
10.1.1. Alcatel-Lucent
10.1.1.1. Company overview
10.1.1.2. Financial performance
10.1.1.3. Product benchmarking
10.1.1.4. Strategic initiatives
10.1.2. Ericsson AB
10.1.2.1. Company overview
10.1.2.2. Financial performance
10.1.2.3. Product benchmarking
10.1.2.4. Strategic initiatives
10.1.3. 6Wind SA
10.1.3.1. Company overview
10.1.3.2. Financial performance
10.1.3.3. Product benchmarking
10.1.3.4. Strategic initiatives
10.1.4. Huawei Technologies Co. Ltd.
10.1.4.1. Company overview
10.1.4.2. Financial performance
10.1.4.3. Product benchmarking
10.1.4.4. Strategic initiatives
10.1.5. Amdocs Inc.
10.1.5.1. Company overview
10.1.5.2. Financial performance
10.1.5.3. Product benchmarking
10.1.5.4. Strategic initiatives
10.1.6. Nokia Solutions and Network
10.1.6.1. Company overview
10.1.6.2. Financial performance
10.1.6.3. Product benchmarking
10.1.6.4. Strategic initiatives
10.1.7. CIMI Corporation
10.1.7.1. Company overview
10.1.7.2. Financial performance
10.1.7.3. Product benchmarking
10.1.7.4. Strategic initiatives
10.1.8. Connectem Inc.
10.1.8.1. Company overview
10.1.8.2. Financial performance
10.1.8.3. Product benchmarking
10.1.8.4. Strategic initiatives
10.1.9. Intel Corporation
10.1.9.1. Company overview
10.1.9.2. Financial performance
10.1.9.3. Product benchmarking
10.1.9.4. Strategic initiatives
10.1.10. ConteXtream Inc.
10.1.10.1. Company overview
10.1.10.2. Financial performance
10.1.10.3. Product benchmarking
10.1.10.4. Strategic initiatives
10.1.11. Juniper Network Inc.
10.1.11.1. Company overview
10.1.11.2. Financial performance
10.1.11.3. Product benchmarking
10.1.11.4. Strategic initiatives
10.1.12. F5 Network Inc
10.1.12.1. Company overview
10.1.12.2. Financial performance
10.1.12.3. Product benchmarking
10.1.12.4. Strategic initiatives
10.1.13. Open Wave Mobility Inc
10.1.13.1. Company overview
10.1.13.2. Financial performance
10.1.13.3. Product benchmarking
10.1.13.4. Strategic initiatives
10.1.14. NEC Inc
10.1.14.1. Company overview
10.1.14.2. Financial performance
10.1.14.3. Product benchmarking
10.1.14.4. Strategic initiatives
10.1.15. Opera Software
10.1.15.1. Company overview
10.1.15.2. Financial performance
10.1.15.3. Product benchmarking
10.1.15.4. Strategic initiatives
10.1.16. HP
10.1.16.1. Company overview
10.1.16.2. Financial performance
10.1.16.3. Product benchmarking
10.1.16.4. Strategic initiatives
10.1.17. Oracle
10.1.17.1. Company overview
10.1.17.2. Financial performance
10.1.17.3. Product benchmarking
10.1.17.4. Strategic initiatives
For more information about this report visit https://www.researchandmarkets.com/r/ky3mp8
Attachment
CONTACT: CONTACT: ResearchAndMarkets.com Laura Wood, Senior Press Manager press@researchandmarkets.com For E.S.T Office Hours Call 1-917-300-0470 For U.S./CAN Toll Free Call 1-800-526-8630 For GMT Office Hours Call +353-1-416-8900

