
 Yahoo Finance
 Globant (NYSE:GLOB) stock performs better than its underlying earnings growth over last five years
When you buy a stock there is always a possibility that it could drop 100%. But on the bright side, if you buy shares in a high quality company at the right price, you can gain well over 100%. For instance, the price of Globant S.A. (NYSE:GLOB) stock is up an impressive 218% over the last five years. And in the last week the share price has popped 5.3%. The company reported its financial results recently; you can catch up on the latest numbers by reading our company report.
The past week has proven to be lucrative for Globant investors, so let's see if fundamentals drove the company's five-year performance.
View our latest analysis for Globant
In his essay The Superinvestors of Graham-and-Doddsville Warren Buffett described how share prices do not always rationally reflect the value of a business. One imperfect but simple way to consider how the market perception of a company has shifted is to compare the change in the earnings per share (EPS) with the share price movement.
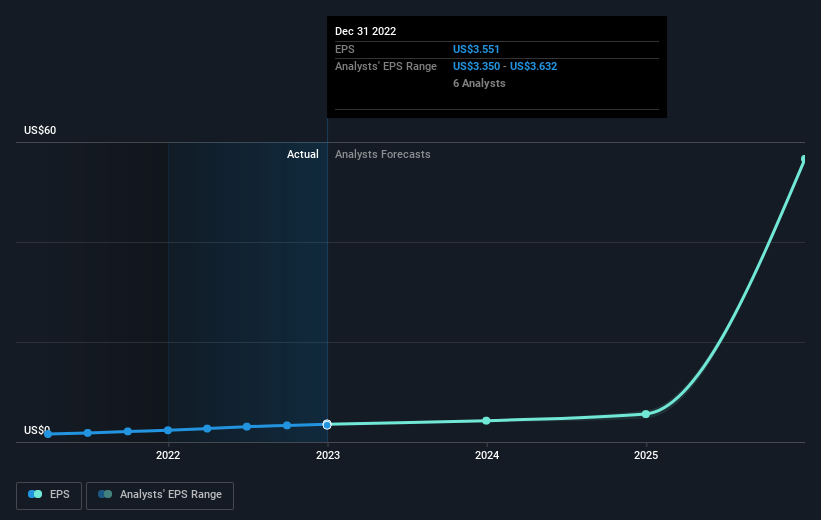
During five years of share price growth, Globant achieved compound earnings per share (EPS) growth of 32% per year. The EPS growth is more impressive than the yearly share price gain of 26% over the same period. So it seems the market isn't so enthusiastic about the stock these days.
You can see how EPS has changed over time in the image below (click on the chart to see the exact values).
We know that Globant has improved its bottom line over the last three years, but what does the future have in store? You can see how its balance sheet has strengthened (or weakened) over time in this free interactive graphic.
A Different Perspective
We regret to report that Globant shareholders are down 26% for the year. Unfortunately, that's worse than the broader market decline of 6.2%. Having said that, it's inevitable that some stocks will be oversold in a falling market. The key is to keep your eyes on the fundamental developments. On the bright side, long term shareholders have made money, with a gain of 26% per year over half a decade. It could be that the recent sell-off is an opportunity, so it may be worth checking the fundamental data for signs of a long term growth trend. Is Globant cheap compared to other companies? These 3 valuation measures might help you decide.
Of course, you might find a fantastic investment by looking elsewhere. So take a peek at this free list of companies we expect will grow earnings.
Please note, the market returns quoted in this article reflect the market weighted average returns of stocks that currently trade on US exchanges.
Have feedback on this article? Concerned about the content? Get in touch with us directly. Alternatively, email editorial-team (at) simplywallst.com.
This article by Simply Wall St is general in nature. We provide commentary based on historical data and analyst forecasts only using an unbiased methodology and our articles are not intended to be financial advice. It does not constitute a recommendation to buy or sell any stock, and does not take account of your objectives, or your financial situation. We aim to bring you long-term focused analysis driven by fundamental data. Note that our analysis may not factor in the latest price-sensitive company announcements or qualitative material. Simply Wall St has no position in any stocks mentioned.
Join A Paid User Research Session
You’ll receive a US$30 Amazon Gift card for 1 hour of your time while helping us build better investing tools for the individual investors like yourself. Sign up here
