
 Yahoo Finance
 Globe International (ASX:GLB) Has Rewarded Shareholders With An Exceptional 435% Total Return On Their Investment
While stock picking isn't easy, for those willing to persist and learn, it is possible to buy shares in great companies, and generate wonderful returns. When you find (and hold) a big winner, you can markedly improve your finances. For example, Globe International Limited (ASX:GLB) has generated a beautiful 405% return in just a single year. It's also good to see the share price up 28% over the last quarter. Also impressive, the stock is up 317% over three years, making long term shareholders happy, too.
Check out our latest analysis for Globe International
To paraphrase Benjamin Graham: Over the short term the market is a voting machine, but over the long term it's a weighing machine. One way to examine how market sentiment has changed over time is to look at the interaction between a company's share price and its earnings per share (EPS).
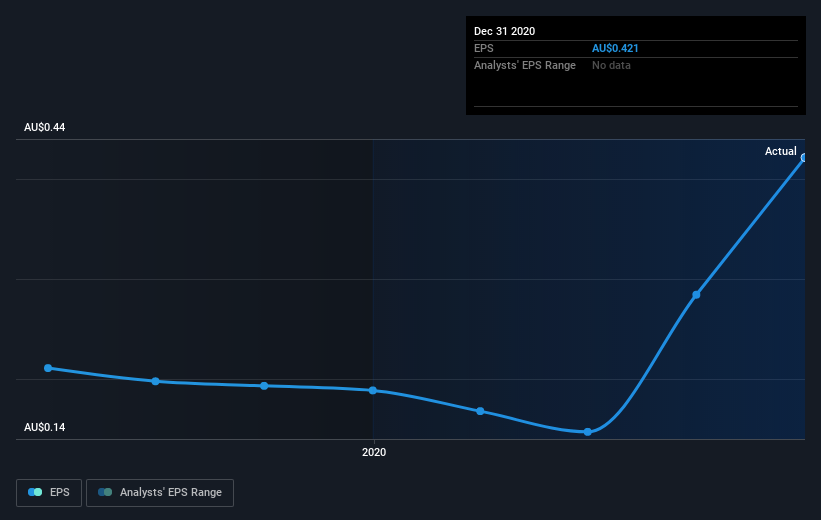
During the last year Globe International grew its earnings per share (EPS) by 124%. The share price gain of 405% certainly outpaced the EPS growth. This indicates that the market is now more optimistic about the stock.
You can see how EPS has changed over time in the image below (click on the chart to see the exact values).
Before buying or selling a stock, we always recommend a close examination of historic growth trends, available here.
What About Dividends?
When looking at investment returns, it is important to consider the difference between total shareholder return (TSR) and share price return. Whereas the share price return only reflects the change in the share price, the TSR includes the value of dividends (assuming they were reinvested) and the benefit of any discounted capital raising or spin-off. So for companies that pay a generous dividend, the TSR is often a lot higher than the share price return. We note that for Globe International the TSR over the last year was 435%, which is better than the share price return mentioned above. And there's no prize for guessing that the dividend payments largely explain the divergence!
A Different Perspective
It's good to see that Globe International has rewarded shareholders with a total shareholder return of 435% in the last twelve months. And that does include the dividend. That's better than the annualised return of 42% over half a decade, implying that the company is doing better recently. Someone with an optimistic perspective could view the recent improvement in TSR as indicating that the business itself is getting better with time. I find it very interesting to look at share price over the long term as a proxy for business performance. But to truly gain insight, we need to consider other information, too. To that end, you should be aware of the 1 warning sign we've spotted with Globe International .
But note: Globe International may not be the best stock to buy. So take a peek at this free list of interesting companies with past earnings growth (and further growth forecast).
Please note, the market returns quoted in this article reflect the market weighted average returns of stocks that currently trade on AU exchanges.
This article by Simply Wall St is general in nature. It does not constitute a recommendation to buy or sell any stock, and does not take account of your objectives, or your financial situation. We aim to bring you long-term focused analysis driven by fundamental data. Note that our analysis may not factor in the latest price-sensitive company announcements or qualitative material. Simply Wall St has no position in any stocks mentioned.
Have feedback on this article? Concerned about the content? Get in touch with us directly. Alternatively, email editorial-team (at) simplywallst.com.
