
 Yahoo Finance
 Globe Life (GL) Q1 Earnings Miss Estimates, Revenues Rise Y/Y
Globe Life Inc.’s GL first-quarter 2024 net operating income of $2.78 per share missed the Zacks Consensus Estimate by 0.7%.
The bottom line improved 10% year over year, primarily driven by higher insurance underwriting income and excess investment income.
Globe Life Inc. Price, Consensus and EPS Surprise
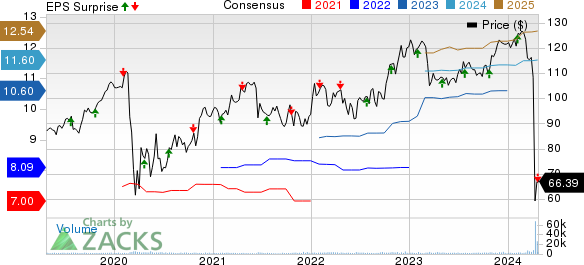
Globe Life Inc. price-consensus-eps-surprise-chart | Globe Life Inc. Quote
Behind the Headlines
Globe Life reported total premium revenues of $1.1 billion, up 5% year over year. This upside was primarily driven by higher premiums from Life and Health insurance.
Net investment income increased 10% year over year to $282.5 million.
The company reported operating revenues of $1.4 billion, up 5.5% from the year-ago quarter. The improvement was driven by growth in Life and Health insurance premiums and higher net investment income.
Excess investment income, a measure of profitability, increased 50% year over year to $43.7 million.
Total insurance underwriting income increased 4.2% year over year to $324 million. The increase was attributable to higher Life and Health underwriting income.
Administrative expenses were up 8.8% year over year to $80.4 million.
Total benefits and expenses increased 5.1% year over year to $1 billion, primarily due to higher total policyholder benefits, amortization of deferred acquisition costs, commissions, premium taxes and non-deferred acquisition costs, as well as other operating expenses and interest expenses.
Segmental Results
Premium revenues at Life increased 4% year over year to $804.2 million, driven by higher premiums written by distribution channels like American Income and Liberty National. American Income and Liberty National gained 7% each year over year. Net sales of $149.4 million increased 7% on a year-over-year basis. Underwriting margins increased 6% year over year to $309 million.
Health insurance premium revenues rose 6% year over year to $341 million, primarily driven by higher premiums from United American, American Income, Direct to Consumer and Family Heritage. Net health sales increased 9% year over year to $54 million. Underwriting margins increased 3% year over year to $93.7 million.
Financial Update
Shareholders’ equity, excluding accumulated other comprehensive income (AOCI), as of Mar 31, 2024, increased 10.2% year over year to $7.5 billion.
As of Mar 31, 2024, Globe Life reported book value per share, excluding AOCI, of $79, up 12.3% year over year.
Operating return on equity, excluding AOCI, was 14.3% in the reported quarter, which contracted 30 basis points year over year.
Share Repurchase
Globe Life repurchased 0.1 million shares worth $15.6 million in the reported quarter.
2024 View
Globe Life projects net operating income in the range of $11.50-$12.00 per share for the year ending Dec 31, 2024. The company anticipates approximately $350-$370 million of share repurchases for 2024.
Zacks Rank
Globe Life currently carries a Zacks Rank #2 (Buy). You can see the complete list of today’s Zacks #1 Rank (Strong Buy) stocks here.
Performance of Other Finance Stocks
American Express Company AXP reported first-quarter 2024 earnings per share of $3.33, which beat the Zacks Consensus Estimate by 12.1%. The bottom line climbed 38.8% year over year. Total revenues net of interest expense amounted to $15.8 billion, which beat the Zacks Consensus Estimate by 0.3%. The top line improved 10.6% year over year in the quarter under review.
Network volumes of $419 billion rose 5% year over year in the first quarter on the back of higher consumer spending. However, the figure lagged the Zacks Consensus Estimate of $420 billion. Total interest income of $5.8 billion increased 31% year over year and beat the consensus mark of $5.6 billion. Provision for credit losses escalated 20% year over year to $1.3 billion due to a rise in net write-offs, partially offset by a reduced net reserve build.
Blackstone Inc.’s BX first-quarter 2024 distributable earnings of 98 cents per share were in line with the Zacks Consensus Estimate. The figure reflected a rise of 1% from the prior-year quarter. Additionally, total segment revenues were $2.55 billion, up 3% year over year. The top line outpaced the Zacks Consensus Estimate of $2.51 billion. Also, on a GAAP basis, BX’s revenues were $3.69 billion, up significantly from $1.38 billion in the prior-year quarter.
The rise in AUM balance was driven by a robust equity market performance in the first quarter. As of Mar 31, 2024, BX’s fee-earning AUM grew 7% year over year to $781.4 billion. Total AUM was also up 7% to $1.06 trillion. Further, Blackstone recorded net inflows of $34 billion in the quarter. As of Mar 31, 2024, the undrawn capital available for investment was $191.2 billion.
BlackRock, Inc.’s BLK first-quarter 2024 adjusted earnings of $9.81 per share surpassed the Zacks Consensus Estimate of $9.42. The figure reflected a jump of 24% from the year-ago quarter. Further, BLK’s total revenues (on a GAAP basis) of $4.72 billion beat the Zacks Consensus Estimate of $4.69 billion. The figure increased 11% year over year.
BlackRock witnessed long-term net inflows of $76 billion during the quarter, though this was somewhat offset by outflows in the cash management strategies. Hence, net inflows were $56 billion in the first quarter. Thus, BLK’s investment advisory and administration fees (the main and largest revenue component) grew 9% from the prior-year period to $3.63 billion. Additionally, performance fees jumped substantially from $55 million in last year’s quarter to $204 million.
Want the latest recommendations from Zacks Investment Research? Today, you can download 7 Best Stocks for the Next 30 Days. Click to get this free report
Blackstone Inc. (BX) : Free Stock Analysis Report
BlackRock, Inc. (BLK) : Free Stock Analysis Report
American Express Company (AXP) : Free Stock Analysis Report
Globe Life Inc. (GL) : Free Stock Analysis Report
