
 Yahoo Finance
 Glory Star New Media Group Holdings (NASDAQ:GSMG) Will Want To Turn Around Its Return Trends
If you're looking for a multi-bagger, there's a few things to keep an eye out for. Firstly, we'd want to identify a growing return on capital employed (ROCE) and then alongside that, an ever-increasing base of capital employed. Put simply, these types of businesses are compounding machines, meaning they are continually reinvesting their earnings at ever-higher rates of return. Having said that, while the ROCE is currently high for Glory Star New Media Group Holdings (NASDAQ:GSMG), we aren't jumping out of our chairs because returns are decreasing.
Return On Capital Employed (ROCE): What is it?
For those who don't know, ROCE is a measure of a company's yearly pre-tax profit (its return), relative to the capital employed in the business. To calculate this metric for Glory Star New Media Group Holdings, this is the formula:
Return on Capital Employed = Earnings Before Interest and Tax (EBIT) ÷ (Total Assets - Current Liabilities)
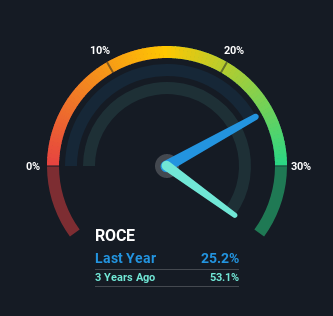
0.25 = US$35m ÷ (US$205m - US$65m) (Based on the trailing twelve months to June 2021).
Thus, Glory Star New Media Group Holdings has an ROCE of 25%. That's a fantastic return and not only that, it outpaces the average of 7.1% earned by companies in a similar industry.
See our latest analysis for Glory Star New Media Group Holdings
In the above chart we have measured Glory Star New Media Group Holdings' prior ROCE against its prior performance, but the future is arguably more important. If you're interested, you can view the analysts predictions in our free report on analyst forecasts for the company.
How Are Returns Trending?
The trend of ROCE doesn't look fantastic because it's fallen from 53% three years ago, while the business's capital employed increased by 529%. Usually this isn't ideal, but given Glory Star New Media Group Holdings conducted a capital raising before their most recent earnings announcement, that would've likely contributed, at least partially, to the increased capital employed figure. Glory Star New Media Group Holdings probably hasn't received a full year of earnings yet from the new funds it raised, so these figures should be taken with a grain of salt.
On a related note, Glory Star New Media Group Holdings has decreased its current liabilities to 31% of total assets. That could partly explain why the ROCE has dropped. Effectively this means their suppliers or short-term creditors are funding less of the business, which reduces some elements of risk. Since the business is basically funding more of its operations with it's own money, you could argue this has made the business less efficient at generating ROCE.
The Bottom Line On Glory Star New Media Group Holdings' ROCE
Even though returns on capital have fallen in the short term, we find it promising that revenue and capital employed have both increased for Glory Star New Media Group Holdings. However, despite the promising trends, the stock has fallen 32% over the last year, so there might be an opportunity here for astute investors. As a result, we'd recommend researching this stock further to uncover what other fundamentals of the business can show us.
On a final note, we found 4 warning signs for Glory Star New Media Group Holdings (1 is a bit unpleasant) you should be aware of.
If you want to search for more stocks that have been earning high returns, check out this free list of stocks with solid balance sheets that are also earning high returns on equity.
This article by Simply Wall St is general in nature. We provide commentary based on historical data and analyst forecasts only using an unbiased methodology and our articles are not intended to be financial advice. It does not constitute a recommendation to buy or sell any stock, and does not take account of your objectives, or your financial situation. We aim to bring you long-term focused analysis driven by fundamental data. Note that our analysis may not factor in the latest price-sensitive company announcements or qualitative material. Simply Wall St has no position in any stocks mentioned.
Have feedback on this article? Concerned about the content? Get in touch with us directly. Alternatively, email editorial-team (at) simplywallst.com.
